Smoke Sense Study App Usage Statistics of Health Symptoms and Smoke Observations
Overview
Participants of the Smoke Sense study in 2017 logged health symptoms and smoke observations weekly using an app developed by EPA researchers. The charts below illustrate usage statistics and participants’ reports of health symptoms and smoke observations collected during the pilot season.
Chart 1A shows the number of Smoke Sense users of the app on Android and iOS was nearly 5,000. Of this number, 46.5% of these users accessed Smoke Sense from Android devices while 53.5% used iOS devices. Chart 1B shows that between all of these Smoke Sense users, there have been over 50,000 unique sessions between August 1 and Dec. 14. The vast majority of users returned to Smoke Sense on multiple occasions to record health symptoms and smoke observations or simply to access information about air quality and fire and smoke events locally or across the nation. Though the proportion of Android users was smaller than iOS users, the Android users contributed to 54.3% of total Smoke Sense sessions.
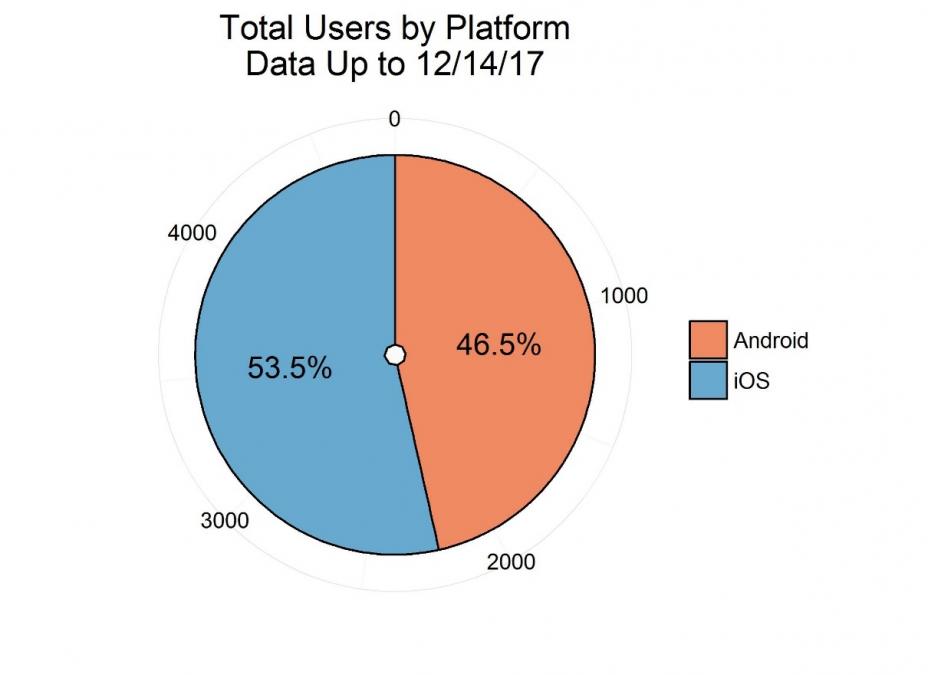
Chart 1A: Smoke Sense users by platform, count and percentage of total
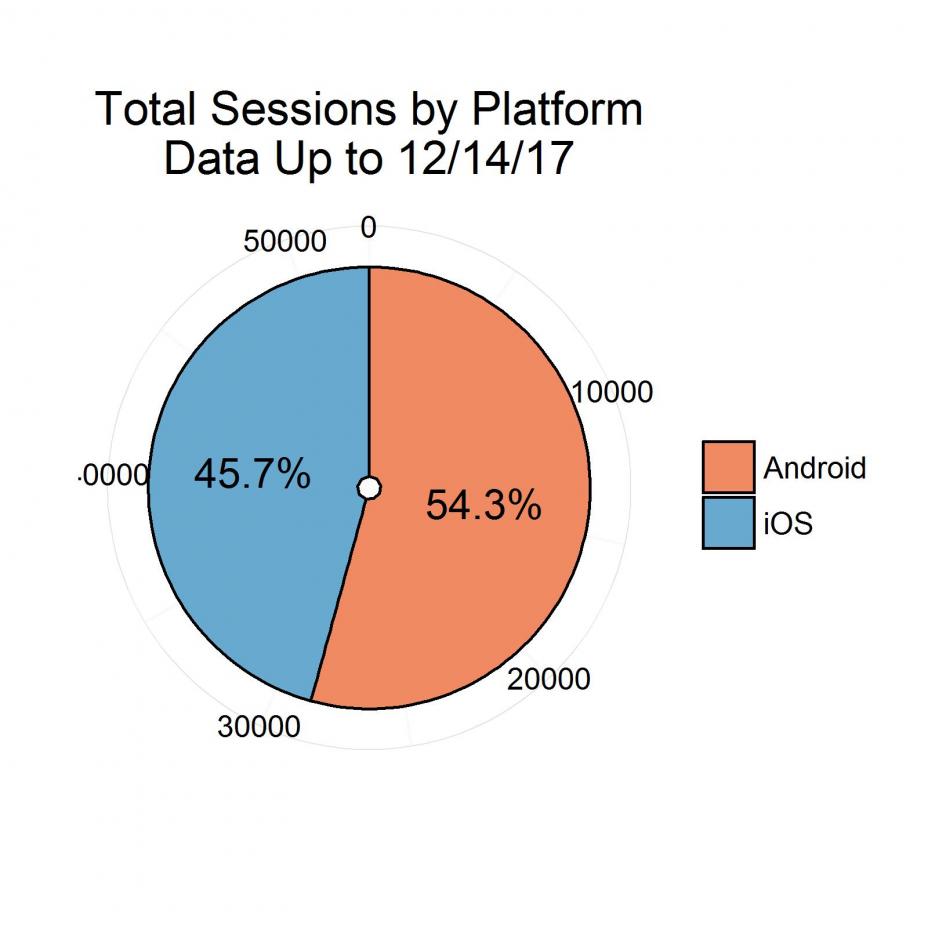
Chart 1B: Smoke Sense sessions by platform, count and percentage of total
Charts 2 shows the number of Smoke Sense users by state. 59% of Smoke Sense users live in California followed by 27.1% who live in Washington and 3.8% who live in Oregon. All other states had fewer than 60 users each (less than 2% of users) so were aggregated to “Other” state, which makes up 10.2% of all users.
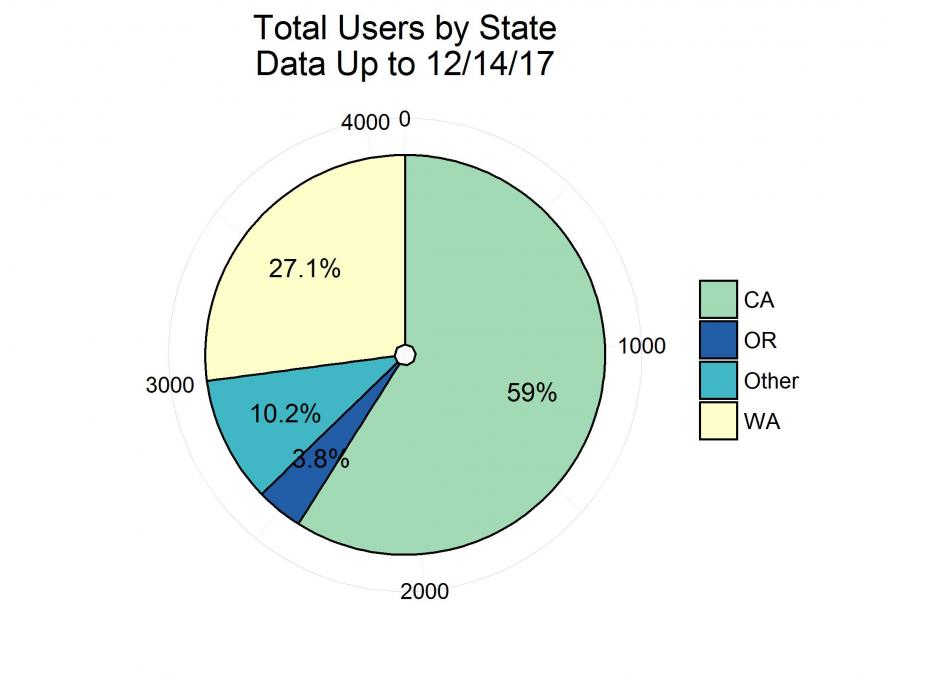
Chart 2: Smoke Sense users by state
Chart 3 shows that among participants who reported experiencing a smoke event in a particular week, about 87% of participants answered “Yes” to having experienced respiratory symptoms in that week. Additionally, about 80% of participants answered "Yes" to experiencing eyes and ears symptoms, about 25% to cardiovascular symptoms, and about 60% to other symptoms.
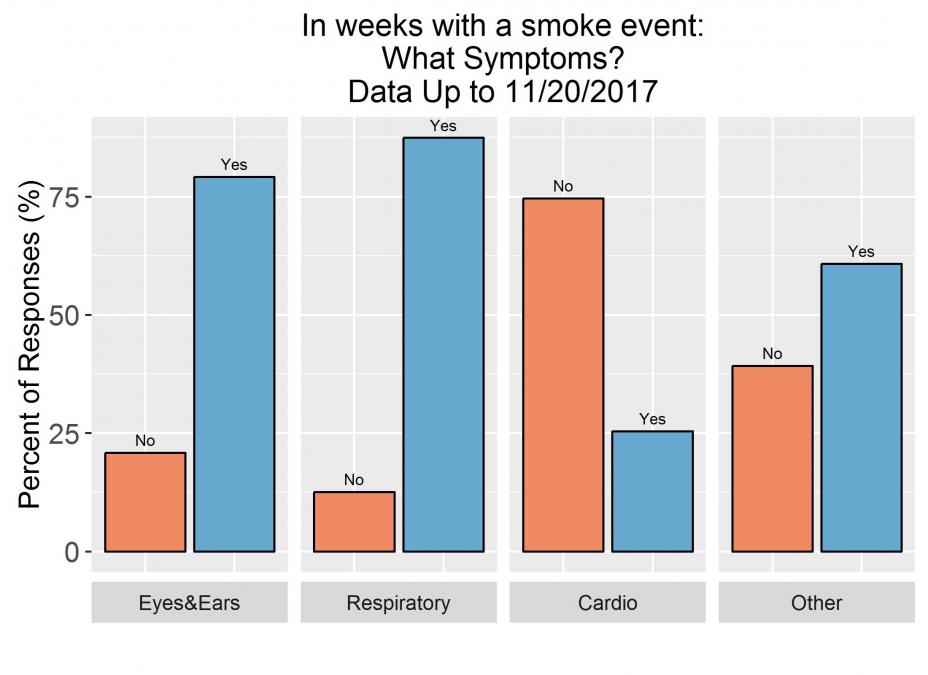
Chart 3: Participant symptoms in weeks WITH a reported smoke event
Chart 4 shows that among participants who did NOT experience a smoke event in a given week. The majority of participants responded "No" to each type of symptom. Only 37% of participants answered “Yes” to respiratory symptoms, followed by eyes and ears (27%), other (25%), and cardiovascular (8%).
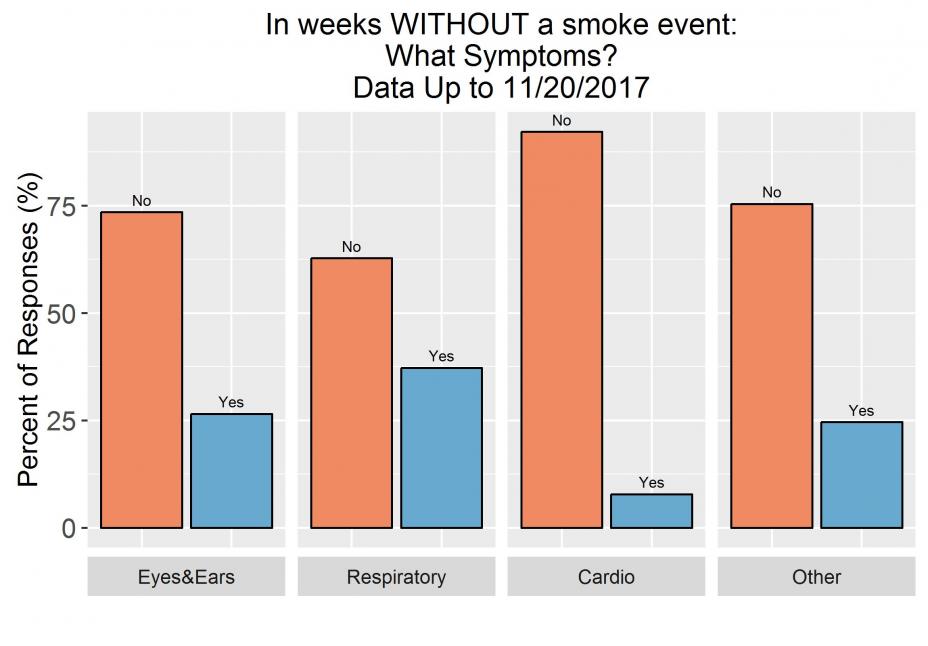
Chart 4: Participant symptoms in weeks WITHOUT a reported smoke event
Chart 5 shows that among participants who experienced a smoke event in a given week, most reported smelling smoke inside their home for either one to two days (36%) or three plus days (20%) while 44% did not report smelling smoke inside their home. Additionally, outside the home, school, or work, more than 50% of participants reported smelling smoke for three or more days, and almost 40% for one to two days during the week of the smoke event.
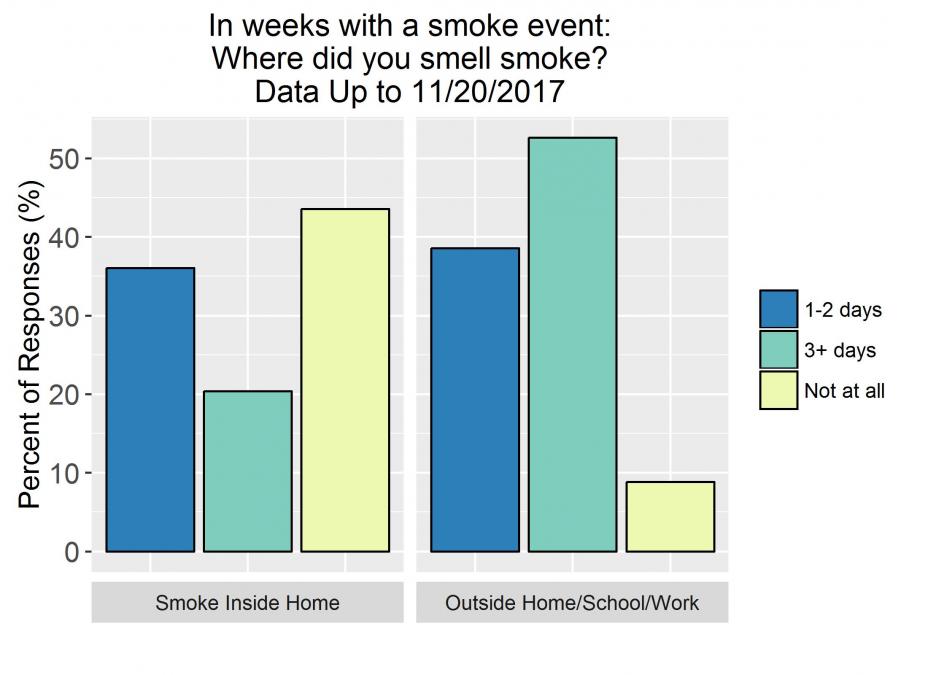
Chart 5: Location and duration of smoke reported by participants in a week with a smoke event
Chart 6 shows that during a week with a smoke event, most participants chose to stay indoors or avoid normal outdoor recreation (over 25% each). Close to 10% of participants each chose to avoid daily activities such as going to work or school and/or use an air cleaner. The following behaviors were each taken by about 5% of participants: used a mask (dust or similar), used a respirator mask, left the area impacted by smoke, and/or took other actions to reduce exposure. Participants may have reported taking multiple actions to reduce exposure. Only five percent of participants didn’t try to reduce smoke exposure in a week where they reported smoked.
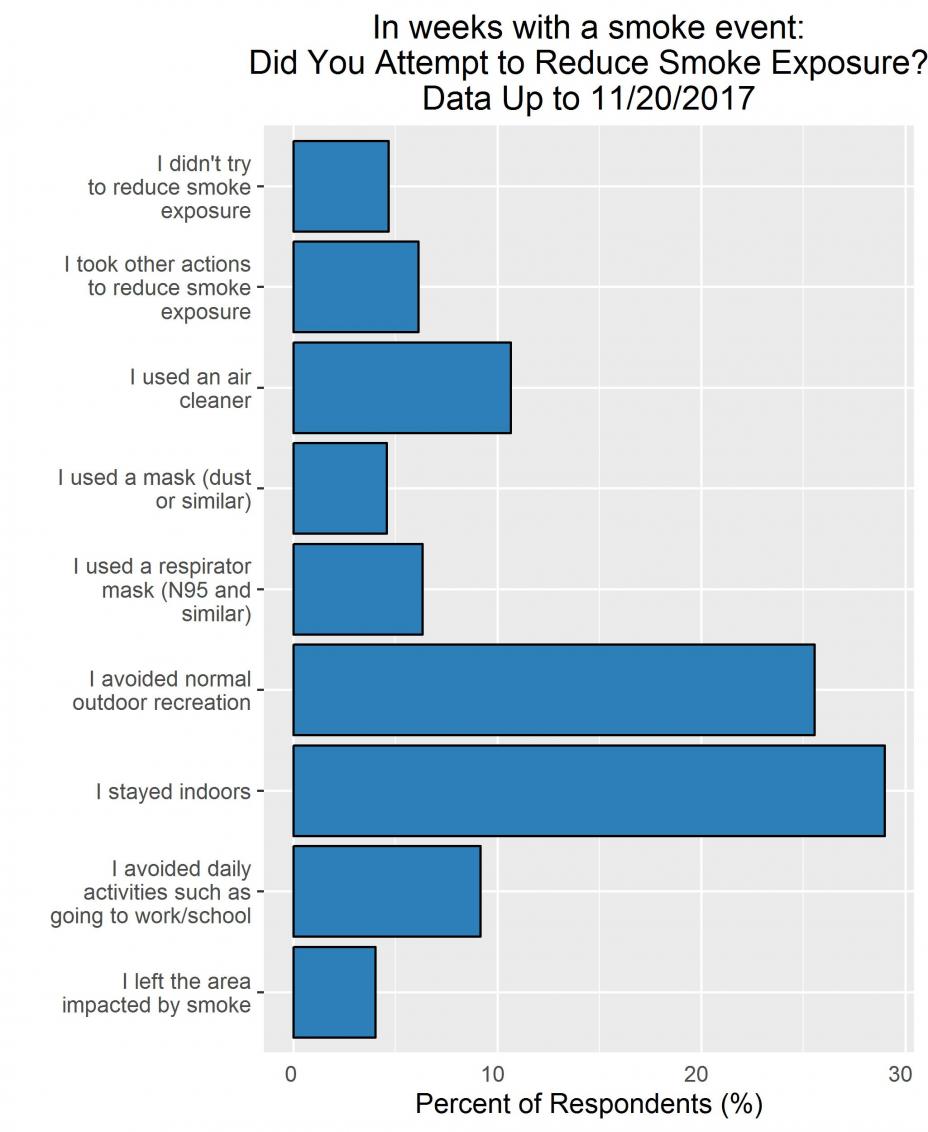
Chart 6: Behavioral actions taken by participants during a week with a smoke event to reduce exposure
Conclusion:
The data gathered by the Smoke Sense Study will be used to advance understanding of the relationship between exposure to wildland fire smoke and subclinical health effects. This can help EPA researchers to develop ways to communicate health risks and design interventions to reduce the public health burden during significant smoke episodes.
Disclaimer:
These are summarized responses within the Smoke Sense Study at EPA’s Office of Research and Development, and data are not intended for use in outside research. The research will be published in the peer review literature following completion of the study.