Air Sensor Collocation Macro Analysis Tool
EPA's Excel-based Macro Analysis Tool (MAT) helps users compare data from air sensors to data from regulatory-grade monitors and interpret their results. This tool addresses one of the major hurdles in air sensor monitoring projects - working with and understanding the data.
The availability of air sensors makes it possible for individuals, communities, researchers, and others to collect their own air quality data. While air sensors can measure many of the same air pollutants that costlier, well-characterized regulatory monitors measure, they are often used for non-regulatory applications, which do not necessarily require the same rigorous standards of accuracy and reliability. Comparing sensor data with collocated FRM/FEM regulatory monitor data is a necessary first-step in interpreting the sensor data results. The Macro Analysis Tool is designed to aid in this comparison. In addition, a collocation guide has been developed to learn more about the collocation process.
What you can do with the Macro Analysis Tool:
- Compare data from air sensors with data from regulatory-grade monitors for comparison.
- Generate a time-series plot to see how sensor and regulatory measurements vary over time.
- Generate a correlation plot to see how sensor and regulatory measurements compare on average.
- Generate a simple linear regression equation so you can adjust your sensor data to make it more comparable to the reference data.
- Compare datasets beyond the specific collocation application it was designed for, such as comparison of data from one sensor to another.
Key Features:
- Time match the sensor and reference data streams.
- Average selected data into longer time averages.
- Plot a time series of selected data.
- Plot sensor versus reference data and develop a regression equation.
Key Limitations:
- Process time stamps expressed as fractions.
- Process input time intervals that vary.
Note: This tool does not run reliably using Excel versions prior to Excel 2016 and Windows versions prior to 7 and the Mac OS.
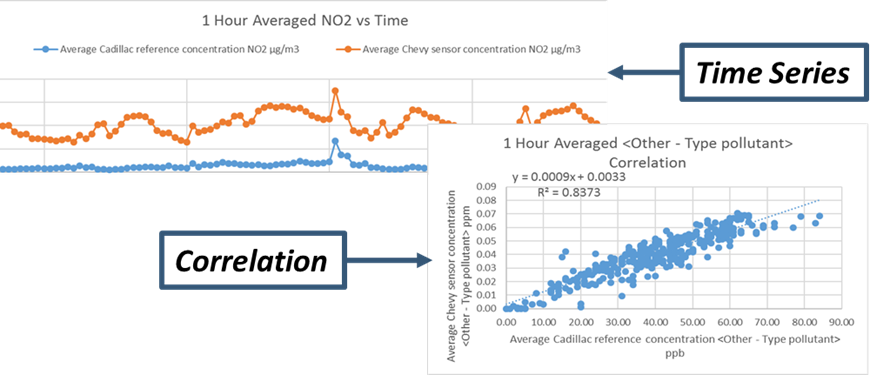 The Macro Analysis Tool creates plots to help compare sensor data to data from FRM/FEM regulatory instruments. The time series plot helps a user see if the sensor and FRM/FEM instrument respond in a similar way to changes in air quality. The correlation plot directly compares the sensor and FRM/FEM data and provides a correction equation.
The Macro Analysis Tool helps conquer many common calculation hurdles
- Measurements that weren’t recorded at precisely the same time, or were collected at different time intervals, can be averaged and time aligned to make comparison possible.
- Data can be averaged up into longer time averages. For instance, 1-minute sensor data could be averaged to 1-hour intervals for comparison with 1-hour regulatory data.
- Users can apply a data completeness threshold to make sure that calculated averages are representative of a time interval. For example, a user may wish to only see 1-hour averaged data if 50 or more minutes of data was recorded.
- Periods of missing data are highlighted for the user.
- Users can flag individual data points for exclusion when they know a data point is false.
This tool was developed as part of the Community-Led Air Sensor Evaluation Project that began in fall 2016. During the year-long project, EPA partnered with one community group (Clean Air Carolina) and one tribal nation (Eastern Band of Cherokee Indians) to conduct a sensor performance evaluation using their choice of air sensors. Both project partner groups used this tool and gave feedback on how to better tailor it for citizen-science users. While EPA developed this tool with citizen scientists and communities in mind, it is useful to the broader air sensor user community, including both experts and non-experts.