How to Use Air Sensors: Air Sensor Guidebook
The original Air Sensor Guidebook was published in 2014 and represented the state of knowledge and technology status at that time. Given new developments in air sensor technology since then, EPA is currently in the process of updating the original guidebook. The new guidebook will be released as an updated version, with the older version remaining available.
Excerpts from the 2014 Air Sensor Guidebook are provided below. The full document can be downloaded by clicking the guidebook image to the right.
- Uses for Air Sensors
The new generation of low-cost, highly portable air quality sensors opens an exciting opportunity for people to use this technology for a wide range of applications beyond traditional regulatory or regulatory-equivalent monitoring. Air pollution sensors are still in an early stage of technology development, and many sensors have not yet been evaluated to determine the accuracy of their measurements. EPA has specific guidelines it must use in establishing regulatory-grade air monitors. No lower cost sensors currently meet these strict requirements or have been formally submitted to EPA for such a determination. The table below summarizes some potential non-regulatory application areas for air sensors and provides brief descriptions and examples.
Descriptions of potential uses for low cost air sensors.
Application Description Example Research Scientific studies aimed at discovering new information about air pollution. A network of air sensors is used to measure particulate matter variation across a city. Personal Exposure Monitoring Monitoring the air quality that a single individual is exposed to while doing normal activities. An individual having a clinical condition increasing sensitivity to air pollution wears a sensor to identify when and where he or she is exposed to pollutants potentially impacting their health. Supplementing Existing Monitoring Data Placing sensors within an existing state/local regulatory monitoring area to fill in coverage. A sensor is placed in an area between regulatory monitors to better characterize the concentration gradient between the different locations. Source Identification and Characterization Establishing possible emission sources by monitoring near the suspected source. A sensor is placed downwind of an industrial facility to monitor variations in air pollutant concentrations over time. Education Using sensors in educational settings for science, technology, engineering, and math lessons. Sensors are provided to students to monitor and understand air quality issues. Information/Awareness Using sensors for informal air quality awareness. A sensor is used to compare air quality at people’s home or work, in their car, or at their child’s school. Sensor performance requirements differ according to the application. The quality of a measurement is dictated by the basic performance of the sensor, the way the sensor is operated, and the way its measurements are analyzed. Understanding the strengths and limitations of an air sensor is important in making sure the data collected is useful for the intended purpose.
- Before You Purchase a Sensor
It is important to "ask questions" before you begin collecting data. This will help you have a clear concept of what it is you are hoping to accomplish via the collection of air pollution data prior to beginning a monitoring project. It is also an important step to take when purchasing an air sensing device. Defining the questions you hope to answer will help identify the pollutant of interest, the field conditions you are likely to encounter, the duration of data collection, and the type of measurements needed (i.e. short-term, mobile measurements vs. long-term, stationary measurements) and the quality of these measurements. All of these data collection characteristics will determine the sensing equipment that is best suited for your data collection purposes.
Here are a few examples of the types of well-defined questions that users and developers should ask to help in the identification of an appropriate sensing device. These examples will be used to illustrate the concepts and choices that are important in using sensors.
a. How can I teach my students about air quality and integrate hands-on data collection into the lesson plan?
b. What is my exposure to air pollution during my usual walking route?
c. Is the nearby oil and/or gas facility creating an air pollution concern in my neighborhood?
- What to Look for in a Sensor
There are several things to think about before purchasing a sensor. First and foremost is to determine a target pollutant. This will guide each of your subsequent decisions, and ultimately lead you to the most appropriate types of sensors for your application. Also important to consider are device specifications like detection range and detection limit, precision and bias, calibration procedures, and others, each of which is discussed below, and in greater detail in Appendix C.
Selecting a target pollutant: What pollutants do you need your sensor to measure? The answer to this will depend on the question you have decided to ask.
- What to Look for in a User Manual of Air Sensors
It is also important that the sensor technology being purchased has a complete and informative user guidebook/manual. This manual will serve as your roadmap of operation, outlining the key operation requirements and characteristics of your monitoring device. Effective manuals will include:
- General operation (i.e. how to turn on and off, how to charge or change batteries);
- How to store and recover data;
- Conditions of operation;
- Sensor expiration date (if there is one);
- Directions for calibration (if the sensor has that capability);
- Expected performance (precision and bias);
- Maintenance requirements;
- Response time (how quickly does the sensor respond to changing conditions);
- Target pollutants;
- Support information (i.e. company representative, customer support number);
- Technical specifications (i.e. type of sensor used, data storage capabilities);
- Known interferences;
- Demonstrations of sensor performance in real-world applications (ideally in the form of scientific articles reporting on sensor tests)
Sensors that come without a user manual, or with a user manual that is incomplete, may be more difficult to use and maintain. It is strongly advised that you read through or inquire about a user manual before purchasing a particular technology.
- How to Collect Useful Data Using Air Sensors
The five basic steps to collecting useful data with air sensors are (1) ask a question, (2) develop an approach, (3) determine sensor location, (4) collect measurements, and (5) understand and communicate results. This section, while not meant to be a comprehensive guide, briefly describes these five steps, which apply to all sensor applications.
- Ask a Question. It is important to take the time to clearly establish and document what question you would like to answer before you begin developing your plan to collect measurements. A simple question, such as "Are ozone concentrations higher in the afternoon than in the morning in my neighborhood?" can help you get started.
- Develop an Approach. Once you have established the question you would like to answer, it is time to plan how the measurements will be made. Think about these issues:
- The dimension of the problem. Read the Air Quality Concepts and Characteristics section on the Air Sensor Guidebook to get an overview of how pollutants may change over time and/or location.
- The "who, what, where, when, and how". Who will take the measurements? What measurements are needed? Where and when should measurements be taken? For how long should measurements be conducted, and how should samples be taken?
- The number and quality of sensors needed. For example, will your question be better answered by one powerful sensor (i.e., very accurate) or multiple inexpensive sensors collecting less accurate data?
- The resources (e.g., funding, knowledge) and labor required.
- How the data will be collected and stored.
- How you will ensure your data are of good quality, and the degree of quality you need. Section 5 and Appendix C of the Air Sensor Guidebook provide further guidance on this topic.
- What additional data (e.g., meteorology, other pollutants, site information) are needed to answer your question? See Appendix B for more information.
- How you might address the potential questions that other parties may ask, a sampling of which is provided in Appendix A of the Air Sensor Guidebook. You should be able to answer the questions in this list if you wish to communicate the value of the data you have collected to others.
- Determine Sensor Location. Careful planning of your measurement approach is an incredibly valuable process that can help minimize complications later. Developing a specific monitoring plan will also allow you to share your ideas and project design with others before you have invested time and/or money. Whenever possible, share your plan with those you hope to communicate with about your future findings, and/or with experts in the field who are willing to give you constructive feedback. Such information sources might include local and state air quality officials, university researchers, and trained community environmentalists. This may help you identify potential problems at an early stage. Such an effort is worthwhile, because it is likely that you will need some or all of this information to answer questions about your measurements when presenting your results. To ensure these results are as accurate as possible, a sensor or instrument should be placed in a location where it can measure the atmosphere or source of interest with minimal interference. A well-placed site would yield data that are representative of the area being monitored.
Why it matters: Air pollution concentrations can be considerably affected by local sources, buildings and other structures, among other factors. You will want to consider potential effects when you choose a monitoring location. If emissions from sources close to the site are not of interest, then the site may not be suitable for monitoring. The data will be most useful if you can measure the pollutant of interest with little impact from other sources at your site. Here are some important considerations:- Allow free air flow to the sensor by making sure it is far enough away from the ground (1-2 meters above the surface) and away from build ing surfaces, if possible (ideally at least 1 meter away).
- Avoid local pollutant emission sources if you are trying to measure more general community levels of pollutants.
- Avoid sources of gases that can react with your pollutant of interest (e.g. ozone is depleted very quickly by certain organic compounds, as well by nitric oxide from tail pipes).
- The inlets to personal exposure monitors must have access to the air the person is inhaling. For example, a personal exposure sensor will not make representative measurements if kept in a purse or pocket. Inlets for personal samplers can be close to your body or clothing as long as they are sampling air outside of your clothes. PM is a special case, since clothing is a source of PM.
- Taking some preliminary measurements can help identify a good monitoring location.
- Collect Measurements. With your measurement approach clearly defined and your sensor properly located, it is time to collect your data. This is not as easy as just turning on your sensor and collecting measurements; you will need some additional preparation before and during data collection. Preparations may include:
- Quality Control – It is advisable that you calibrate a sensor before collecting measurements, and at periodic intervals during measurement collection, to test instrument response to changes in concentrations. A calibration procedure checks an instrument’s response by comparing them to a standard or reference value. Sensor calibration is vital for producing accurate data. Ideally, calibrations are carried out under the same conditions (temperature and humidity ranges, concentration ranges, background air, etc.) as those in which the instrument will collect measurements, because many sensors are strongly influenced by these conditions.
Sensor manuals often include information on how to calibrate a device (if necessary – some devices can be purchased pre-calibrated).
Likewise, sensors should be evaluated for precision by testing them multiple times with “clean” air containing none of the pollutant. Such testing is then followed up by testing the unit multiple times with an air source having a known concentration of the pollutant. Data at the “zero” and higher concentration will allow you to determine how well the sensor repeats itself under various conditions.
Bias, an error in the measurement that is repeatable, can be determined by taking multiple measurements with the sensor and comparing these data with the “true” concentration. The true concentration can be established by a reference monitor located in close proximity to the sensor. - Sensor Maintenance – Some actions may be required to maintain sensor performance over the measurement period. Sensor maintenance processes include regularly cleaning internal surfaces (especially optics) to prevent the buildup of bugs or dust, replacing filters and/or batteries, and examining site features to ensure that no significant changes to the landscape have occurred.
- Data Review – A data review is a technical evaluation of the data collected by a monitoring device. It is a good idea to evaluate the quality of your data during the collection phase to identify and correct potential problems that may arise. In order to do this, analyze data to look for seasonal, day/night, or weekday/weekend patterns. An absence of expected patterns may indicate a problem with your sensor or with your measurement approach.
- Data validation – Data validation is the process of evaluating collected data against established acceptance criteria to determine data quality and usability. As you are collecting data, it is important to visually screen for odd patterns, decreases in overall response, and other unusual features. If you wait until your study is complete, it will be too late to fix these issues, which tend to produce data that look too regular or change too abruptly to be caused by natural atmospheric phenomena. Some specific problems which may occur during data collection include:
- Interferences - factors that hinder, obstruct, or impede the ability of a sensor to make accurate measurements. Interferences may have a positive or negative effect on sensor response, and can include anything from pollutants or other chemical compounds that are not of interest to weather conditions and dirt/dust/insects. It is possible for a sensor to respond to several different interferences simultaneously. Manufacturers usually disclose pollutants and weather conditions that may impact sensor performance, but may not describe how severely the sensor will be affected. Before using a sensor to monitor air quality, consider possible sensor interferences, test for them, and minimize them if possible.
- Drift – refers to a gradual change in a sensor’s response characteristics over time. Instrument drift may lead you to wrongly conclude that concentrations have increased or decreased over time. Drift can be positive or negative, and it may occur due to a variety of reasons. One way to reduce drift is to calibrate the sensor frequently so that the instrument only drifts a small amount between each recalibration. The frequency of calibration needed will depend on how much drift occurs.
- Quality Control – It is advisable that you calibrate a sensor before collecting measurements, and at periodic intervals during measurement collection, to test instrument response to changes in concentrations. A calibration procedure checks an instrument’s response by comparing them to a standard or reference value. Sensor calibration is vital for producing accurate data. Ideally, calibrations are carried out under the same conditions (temperature and humidity ranges, concentration ranges, background air, etc.) as those in which the instrument will collect measurements, because many sensors are strongly influenced by these conditions.
- Analyze, Interpret, and Communicate Your Results. The way you present your results to your audience is critical to successfully sharing your understanding of the data and achieving the objectives of sensor-based air quality data collections. Common ways of visualizing data are: graphs of pollutant concentrations over time to show daily, weekly, seasonal, or yearly variation in concentrations; charts of wind direction and/or pollution to identify sources, and maps plotting data from several sensors to illustrate patterns in concentrations. Generally, simply showing the measurements that you have collected will not be sufficient; your audience will want to know about all the steps that you took to ensure data quality:
- Quality Assurance – Adequate planning to ensure that sensor design and use met the performance requirements of your specific application. Depending on your intended use of the data you collect, you might consider data quality assurance at various levels. For instance, data intended for a direct comparison with State or Federal monitoring would require significantly more quality assurance than a general survey of pollutant concentrations for informational purposes only (such as an educational event for a grammar school).
- Quality Control – Sensor calibrations, precisions and bias checks, maintenance, and data audits required for your application during data collection to identify and correct potential issues such as sensor degradation, problems with sensor location, etc.
- Quality Assessment – Determination of the quality of your measurements and sufficient analysis of the data prior to reaching final conclusions.
Keep in mind that using sensors to answer a question about air quality is often an iterative step-by-step process. You may find that your measurements do not satisfactorily answer your question, or you may find yourself with many more questions after analyzing your data. Reevaluate your approach and repeat the steps described above as needed.
- Ask a Question. It is important to take the time to clearly establish and document what question you would like to answer before you begin developing your plan to collect measurements. A simple question, such as "Are ozone concentrations higher in the afternoon than in the morning in my neighborhood?" can help you get started.
- Sensor Performance Guidance
The performance of an air sensor or instrument describes its overall ability to measure air pollution. This section provides initial guidelines on how well a sensor or instrument needs to perform in order to be used for different types of air pollution applications. Specifically, we define each application, provide performance metrics for a range of different applications, and provide several real-world examples.
5.1 Application Areas
We have defined five application areas of interest to sensor users. These are: I) Information and Education, II) Hotspot Identification and Characterization, Ill) Supplementary Network Monitoring, IV) Personal Exposure Monitoring, and V) Regulatory Monitoring, as discussed below. Several real-world examples from organizations using sensors are provided to illustrate these application areas. For your reference, Appendix C provides a detailed discussion of a number of technical considerations, including how to find the precision and bias of a specific sensing device. It must be stated that no low cost sensors meet the Regulatory Monitoring requirements and the discussion here is for informational purposes only.
Tier I. Education and Information. Educational applications use sensors as teaching tools. These applications center around informational measurements, which are intended to foster informal and qualitative awareness. For example, an instrument might indicate the presence or absence of a pollutant by a signal such as a light going on or off. Or, a device may use qualitative indicators, such as colors, to communicate a general sense of air quality. Such measurements can be used for relative comparisons between air pollution levels in two locations or at different times, rather than for measurement of absolute levels. Measurements like these may help address questions such as: Is air pollution on my daily commute to work higher or lower than at home? Is air pollution higher today compared to yesterday? Where would it be best for me to run or bike today? Sometimes these sensors may not report air quality in traditional concentration units. However, users may still find measurements made by these unitless scales or colors to be useful for making relative comparisons.
The uncertainty in these types of measurements is quite large. The expectation would be that the air pollution sensor is directionally consistent with pollutant trends; for example, a light might consistently turn on if a PM concentration is 50-100 μg/m3 or higher, and consistently turn off if measurements are below this threshold. Even if the "estimated" concentration is appreciably higher or lower than the "true" concentration when using such a device and results in an accuracy error of 50% ( e.g. 10 ppb versus 15 ppb ), the device might still be useful in educating others where data quality needs are less important.
Sensor technology and sensor use fits within the Next Generation Science Standards (NGSS) - new K-12 science standards that work provide students with an internationally benchmarked science education. The use of sensor technology in an education setting can also help advance science, technology, engineering and mathematics (STEM) learning at various grade levels. Exposing students to STEM education and hands-on science projects (i.e. the development and deployment of air pollution sensors) can improve classroom learning and help support the President’s goal to provide students at every level with the skills they need to excel in the fields of science, technology, engineering and math.
Tier II. Hotspot Identification and Characterization typically uses fixed location and/or mobile sensor systems to map pollutants and determine emission sources. For example, this can be done by clustering a network of sensors downwind of an industrial facility or shipping port; placing a network of near-road sensors along an urban interstate freeway; or placing sensors in a vehicle for industrial fence line surveys or on an aircraft that flies in and out of a power plant emissions plume. In most cases, the sensors will be making measurements close to the emission location, where pollutant concentrations are usually high. For Tier II applications, a bias and precision of ±30% might be reasonable.
Tier III. Supplementary Network Monitoring (also referred to as “exploratory monitoring”) is the use of air sensor systems to complement an existing network of air quality monitors. This is done by supplementing the regulatory network with many lower-cost devices, filling in spatial gaps. These additional sensors may be at a permanent fixed location, or on mobile platforms, depending on network objectives. The data from supplemental monitoring may not be sufficient for regulatory purposes, but may help you identify potential pollution sources of interest. A selection of state and regional officials said in interviews that if they were presented with community group data that had a precision and bias of 20% or better, they would be willing to investigate the findings further (provided the project design and execution seemed reasonable). This general consensus must not be considered as representative of all state and federal air quality officials or their opinions on this subject. Likewise, these descriptions of precision and bias error ranges are application dependent and probably highly conditional to the pollutant being monitored and the circumstances involving the data collections. European guidance suggests a precision and bias range of 30-50% might be applicable. Note that there currently exists no U.S.-based defined role for supplemental monitoring requirements and the discussion here is solely for informational purposes.
Tier IV. Personal Exposure Monitoring encompasses any application where a person’s exposure to air pollution is monitored, often to evaluate the impact of air pollution on health. This may include measurements taken to protect an individual whose health might be impaired by elevated air pollution, or an epidemiological research study to help understand the effects of air pollution on a group of people. An example of one such effort was the U.S. EPA’s Detroit Exposure Research Study (DEARS), where participants were involved in wearing portable sensors to document their exposures. Personal exposure studies have historically been research projects where people wear devices that measure air quality as they go about their daily routines. In the future, people may monitor their own exposure to air pollution to help make medical decisions. Personal exposure is currently estimated using EPA’s Air Quality Index (AQI), which communicates health risks from air pollution using a color-coded scale. For this application, a bias and precision of 30% or better might be a goal for such air quality monitoring scenarios.
Tier V. Regulatory Monitoring includes monitoring for criteria pollutants to determine if an area is in compliance with the National Ambient Air Quality Standards. In the U.S., regulatory monitoring is performed by air quality agencies and governed by the performance requirements specified by the Code of Federal Regulations. Instruments or technologies which are used to comply with requirements for regulatory monitoring must meet the requirements of Federal Reference Methods or Federal Equivalent Methods. Requirements include meeting stringent measurement quality objectives and substantial operational requirements, and are therefore considered the “gold standard.” In contrast, there are no such written requirements for measurements in Tiers I-IV. No low cost sensors have been approved to collect regulatory monitoring data.
The U.S. EPA also regulates air quality associated with a select number of air toxics. One example of such a pollutant is benzene, an air toxic widely distributed in our environment. Sensor users are encouraged to review the Air Toxics Monitoring Methods web page for specific information on data quality for these pollutants. Often precision error of no more than 15% is required to ensure adequate measurements of these air pollutants.
- Suggested Performance Goals for Each Application
As outlined above, sensor systems have the potential to be used across specific air quality measurement applications, which can range from those requiring relatively high-performing measurements to informal projects with minimal data quality requirements.
The table below provides information about how well your sensor must perform so that the data you collect will be useful. Which of the tiers above best describes the specific purpose of your monitoring effort? Additional data quality indicators and associated performance characteristics are required for regulatory monitoring and may be required for other applications requiring higher data quality.
- Bias
- Precision
- Data averaging time
- Data completeness
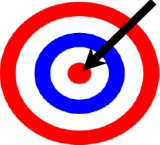
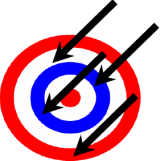
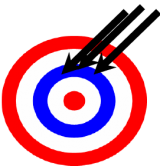
Consider precision and bias: Precision and bias are terms that refer to the accuracy of a sensor measurement (see Figure 3-1). Accuracy is the overall agreement of a sensor's measurement to the true value. Precision refers to how well the sensor reproduces the measurement of a pollutant under identical circumstances. Bias refers to measurement error. For example, a sensor may always measure a little higher or lower than the true concentration.
Before purchasing a sensor, you should consult the manufacturer's specifications about reported precision and bias for the sensor.. In addition, the user should then conduct their own precision and bias measurements as defined in Append ix C of the Air Sensor Guidebook to further qualify the value of the data being collected. Table 5-1 in the Air Sensor Guidebook identifies acceptable ranges of precision and bias for various sensor applications.
Accuracy= how close to "true" concentration
Precision= being able to consistently predict the same concentration
Bias= a systematic (common) error of reporting a value higher or lower than the true value
Figure 3-1.Graphics illustrating accuracy, precision, and biasYou should also be aware that accuracy, precision, and bias of a sensor can change over time. For example, exposure to warm temperatures or humid air may lead to a gradual increase in bias (also known as drift). The sensor may experience interference from other chemicals in the atmosphere that could lead to erroneous concentration estimates. Some sensors may come with an "expiration date" after which its measurements are no longer likely to be accurate. For more detailed information on precision, bias,and related concepts, please consult Appendix C of the Air Sensor Guidebook.
Data averaging time is a key performance metric because precision can be improved when more data from a particular measurement system are averaged together. Data are often averaged, or aggregated, to facilitate comparison to measurements from another instrument, health-based benchmarks, or environmental standards. Data averaging helps improve the quality, usefulness, and manageability of your data. The exact type of averaging will depend on your application and the question you are trying to answer.
The table below provides appropriate averaging times over which data should be averaged for various uses. For example, if you are interested in observing a pollutant concentration trend over the course of a month, you may want to analyze your data to 1-hour or 24-hour patterns. You will be able to see how the concentrations change, but averaging will reduce the amount of data you are working with to a manageable size. It will also minimize the effects of outliers (those individual data points that stray far from the average). On the other hand, if you would like to identify a pollution hotspot, you may prefer to use a shorter averaging period, such as a few minutes, to capture the precise location of the hotspot. A shorter averaging period would allow you to detect the hotspot in your data as the sensor moved around the area of interest.
Data completeness refers to the amount of data that was actually obtained, compared to the amount that was expected (for example, a sensor operating correctly and providing data for 4 days out of a 5 day monitoring test would have 80% data completeness).
Detection limit is another important performance metric to consider, but because detection limit needs can vary between projects it is better to assess requirements on a case-by-case basis. A wide range of factors influence sensor performance, including interferences from other gases and particles and methods of operating the sensor.
The suggested performance goals are different for each of the five application areas (tiers). Tier V is the highest quality level discussed, representing the regulatory monitoring application. Applications in lower tiers have less stringent performance goals.
Examples of Suggested Performance Goals for Sensors for 5 Types of Citizen Science Applications in Comparison to
Regulatory Monitoring RequirementsTier Application
AreaPollutants Precision
and Bias
ErrorData
CompletenessRationale (Tier I-IV) I Education and Information All <50% ≥ 50% Measurement error is not as important as simply demonstrating that the pollutant exists in some wide
range of concentration.II Hotspot Identification and Characterization All <30% ≥ 75% Higher data quality is needed here to ensure that not only does the pollutant of interest exist in the local
atmosphere, but also at a concentration that is close to its true value.III Supplemental
MonitoringCriteria pollutants, Air
Toxics (incl. VOCs)<20% ≥ 80% Supplemental monitoring might have value in potentially providing additional air quality data to complement existing monitors. To be useful in providing such complementary data, it must be of sufficient quality to ensure that the additional information is helping to “fill in” monitoring gaps rather than making the situation less understood. IV Personal Exposure All <30% ≥ 80% Many factors can influence personal exposures to air pollutants. Precision and bias errors suggested here are representative of those reported in the scientific literature under a variety of circumstances. Error rates higher than these make it difficult to understand how, when, and why personal exposures have occurred. V Regulatory Monitoring
O3
CO, SO2
NO2
PM2.5, PM10<7%
<10%
<15%
<10%≥ 75% Precise measurements are needed to ensure high quality data is being obtained to meet regulatory requirements Note: These are guidelines only (Tier I- Tier IV), and are likely to evolve over time as technology continues to develop and the state of the science continues to advance. *The amount of data needed for any air quality purpose is highly specific to that purpose and could range from minutes to even years of data measurements.
- Maintaining Your Sensing Device
Air monitoring technology, like most other forms of technology, requires careful care and maintenance to ensure proper functionality and reliable performance. These preventative actions are necessary in both the short- and long-term, and may vary with the specific monitoring technology being utilized. By properly caring for a monitoring device you can reduce errors in data collection, extend the shelf-life of the device, and save money that would otherwise be spent on replacement parts and repair services.
Maintenance Processes
Maintenance processes are the actions required to maintain sensor performance over an extended period of time. Good maintenance processes can help maximize and sustain sensor performance. Typical maintenance processes include regularly:
- Calibrating with pollutant standards and flow meters.
- Cleaning internal and external surfaces and components to prevent the buildup of bugs, dust, etc.
- Replacing filters and consumables.
- Replacing the sensor when it has failed or reached its lifespan of service.
- Replacing rechargeable batteries.
- Reviewing (visually inspecting) data for odd patterns, a decrease in overall response, drift in the baseline, and other unusual features. Instrument problems tend to produce data that often look too regular and repeatable, or that change too abruptly, to be due to natural atmospheric phenomena.
- Inspecting sensor placement to ensure that no significant changes have occurred (e.g., tree growth, building changes, etc.).
Developing a set of maintenance processes relevant to your sensor helps the user consider how best to deploy and maintain the sensor. Developing and maintaining a logbook to ensure maintenance occurs at regular intervals is helpful.
Learn more:
PM 2.5 -Continuous MonitoringSee the Standard Operating Procedures for regulatory monitors in the Resources by Category section of the Air Sensor Toolbox web page for examples of maintenance done on PM2.5 monitors.
- Questions to consider before collecting air quality measurements
If and when you decide to share your data with others, it is likely they will have a number of questions regarding the data you’ve collected and the techniques you’ve employed. Below we have tried to provide a list of the types of questions to expect. While this list is by no means exhaustive, it gives a general outline of the information you are likely to be asked for.
Basics
- What do you want to find out or show with your measurements?
- What pollutants did you measure?
- Do you consider this a nuisance or a health hazard? Is this a recurring problem?
- Do you know the normal levels for the pollutant, including seasonal and day/night profiles?
- Do you have Standard Operating Procedures (SOPs) (detailed written instructions so that measurements are taken in a consistent way)?
- Did you receive adequate training in how to operate the device and maintain it?
Monitor
- What instrument/sensor did you use?
- How were the measurements taken?
- When did you make your measurements? (i.e. time of day/night, day of week, season)
- How long was the period during which you collected measurements?
- How did you ensure that quality measurements were collected? (How did you calibrate your sensor? How did you estimate precision and bias?)
- Did you co-locate your sensor near regulatory monitors or other approved measurement systems to evaluate their performance?
- How were samples identified and their identity recorded and tracked as they were transferred to others or analyzed?
- What, if any, additional data were collected? (e.g., wind measurements, site photos, GPS, activity logs, event logs, health info)
Location/Surrounding Environment
- Where were the measurements collected?
- Were there other emission sources near the location you were measuring that could have mixed with the pollutants coming from the source of interest? (e.g., roadways, other industrial facilities, etc.)
- Was anyone, including you, smoking nearby when you collected the measurements?
- Did you take the measurements while in a moving vehicle or were you stationary?
- How were you holding the sensor, or was it attached to a vehicle or stationary object?
- What were the weather conditions?
- Were you indoors or outdoors while taking measurements?
Data Analysis
- How will the data be analyzed? (e.g., compare with meteorological measurements, other site data)
- How will you differentiate the source you are trying to measure from the background?
- Did you average your measurements and if so, how?
Other
- Is this an anonymous report, or will you provide contact information for follow up?
- Did you have any interaction with the people creating the emissions? Have you in the past?
- Air Quality Concepts and Characteristics
Tthe table below outlines various concepts and characteristics that provide a good foundation for understanding air pollution. Concepts defined below are generalizations of those reported in the scientific literature for a variety of pollutants and general air quality discussions.
Air quality topics, discussion, and relevance.
Topic Discussion Relevance to Sensor Development/Use Primary vs. secondary pollutants Pollutants may be emitted directly by a source (primary pollutants) or may be formed as a product of a chemical reaction in the air (secondary pollutants). Primary pollutants that contribute to the formation of secondary pollutants are also called precursors.
Spatial difference in primary pollutants can be smaller for secondary pollutants.
Consider whether a pollutant of interest is primary or secondary pollutant to help select a monitoring location. In some cases, it may be easier to determine the source of a primary pollutant than the source of a secondary pollutant. Short-lived vs. long-lived pollutants The atmospheric lifetime of a pollutant is the average amount of time the pollutant resides in the atmosphere before it is removed by reacting to form a new molecule or depositing onto a surface. This lifetime varies significantly for each pollutant according to its likelihood of reacting with other species (reactivity) or depositing.
Species with longer atmospheric lifetimes tend to be more uniformly distributed in the atmosphere, while concentrations of species with shorter atmospheric lifetimes may be more variable in space and time. Atmospheric lifetime of some chemicals may be affected by seasonal temperatures. Short-lived pollutants that react quickly after they have been emitted may be highly variable in space and time. Long-lived pollutants typically show less variation over distances or time.
Detecting a short-lived pollutant requires a sensor that responds quickly.
A slower sensor response may be used for detecting long-lived pollutants,
especially if the sensor is not moving.Local vs. regional
vs. global scaleThe atmospheric lifetime of a pollutant governs whether a source will affect air quality on a local, regional, or global scale. While some air pollution problems are limited to the local area where pollution is emitted (e.g., 1,3-butadiene, a shortlived pollutant), others are transported and impact air quality across cities or entire regions of the country (e.g., ozone, PM2.5). For some pollutants, emissions from everywhere on earth contribute to a global problem (e.g., CO2). Knowing the lifetime and emission sources of the pollutant of interest helps
you understand whether concentrations are influenced by a local source
or distant sources.Weather (e.g., sunlight, winds, temperature) Concentrations of pollutants are also controlled by weather, including sunlight, temperature, humidity, clouds, precipitation, and winds. Concentrations can increase more rapidly when winds are stagnant.
Higher winds typically dilute pollutant concentrations, but may lead to increased concentrations of other pollutants (such as dust).
Air quality and weather are linked. Weather can affect both air pollution
concentrations and sensor performance. Therefore, it is very important that you know how weather conditions can influence your sensor
measurements.Time of day Some pollutants have strong day/night patterns due to source patterns or meteorological changes. Sensor performance may vary throughout the day due to changes in source patterns and weather. Day of week Concentrations of some pollutants vary according to the activity schedule of the source (e.g., traffic patterns, industrial schedule). When developing a measurement plan, consider the day-of-week pattern in emissions from the sources you are trying to measure. Season Some pollutants display a strong seasonal variation because of differences in emissions patterns, formation processes, and atmospheric longevity. For example, wildfires emit particles, VOCs, and NOx, and are more prevalent in dry, warm conditions; residential wood burning, however, may be more important in the winter. Consider the seasonal variation of the pollutant of interest to inform your study design. Sensor systems may need to work in particularly
adverse conditions such as extreme heat, humidity, or cold.Near-source concentrations Concentrations of primary pollutants are typically highest very close to their emissions source. Concentrations generally decrease rapidly within the first few hundred feet of a source as the pollutants are transported and dispersed.
Consider concentration gradients in your study design. More than one type of sensor (or a sensor system with more than one operational mode) may be needed, depending on the range of concentrations that
will be measured.Multiple, well distributed sources When there are many widely distributed sources in an area, such as gasoline stations in an urban environment, concentrations may be very similar across the area. A network of sensors (upwind, near-source, and downwind) may be needed to identify these sources. Man-made vs.
naturally occurring pollutant sourcesTypically, measurements focus on human influenced sources, but there are natural sources such as fires, lightning, windblown dust, and volcanic activity. Consider all sources of the pollutant of interest when designing your study. Pollutant transport The distance a pollutant may be transported is governed by atmospheric chemistry (formation and depletion reactions), weather (air mass movement and precipitation), and topography (mountains and valleys that affect air movement). The longer a
pollutant stays in the atmosphere, the farther it can be transported and the harder it becomes to identify its source.Understanding how pollutants are transported can help you identify the
source.
- Technical Considerations
The quality of data collected with sensors can vary greatly depending on sensor design and your deployment strategy. You must consider the following factors carefully while planning for, making, and processing measurements if you are to produce quality data and useful results. You should be able to show that the quality of the data you collected is sufficient to meet the performance requirements of the application and of the intended audience. Several factors to consider in order to collect quality measurements from air sensors, regardless of the intended application air:
- bias
- precision
- calibration
- detection limit
- response time
- linearity of sensor response
- measurement duration
- measurement frequency
- data aggregation
- selectivity
- interferences
- sensor poisoning and expiration
- concentration range
- drift
- accuracy of timestamp
- climate susceptibility
- data completeness
- response to loss of power