What Do My Sensor Readings Mean? Sensor Scale Pilot Project
Note: EPA is no longer updating this page but is keeping it available for reference.
EPA conducted a pilot project in 2016 to test a new tool for making instantaneous outdoor air quality data useful for the public. The new “sensor scale” is designed to be used with air quality sensors that provide data in short time increments–often as little as one minute. EPA developed the scale to help people understand the one-minute data the stations provide and how to use those data as an additional tool for planning outdoor activities.
EPA tested the scale using data from the community-based Village Green stations, which provide one-minute ozone and particle pollution data for seven U.S. cities.
Frequent Questions about the Sensor Scale Pilot Project
What is the low-medium-high-very high scale?
The tables below show the pilot “sensor scale” for ozone and particle pollution. The low-medium-high-very high scale is designed to help people understand the 1-minute data, and how to use that data as an additional tool for planning their outdoor activities.
In May 2016, EPA launched a four-month pilot project to evaluate a “sensor scale,” using air quality data provided from the Village Green Project, a community-based activity to demonstrate the capabilities of new real-time monitoring technology.
The pilot scales and messages are in the tables below:
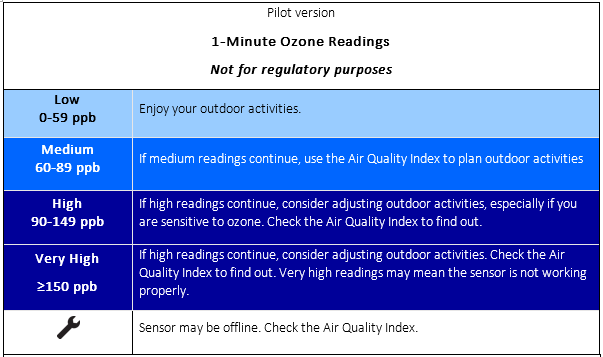
| Pilot Scales | Message |
|---|---|
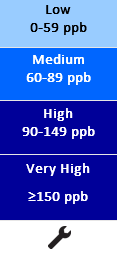
| Low 0-59 ppb |
Enjoy your outdoor activities. |
| Medium 60-89 ppb |
If medium readings continue, use the Air Quality index to plan outdoor activities. |
| High 90 -149 ppb |
If high readings continue, consider adjusting outdoor activities, especially if you are sensitive to ozone. Check the Air Quality Index to find out. |
| Very High >= 150 ppb |
If high readings continue, consider adjusting outdoor activities. Check the Air Quality Index to find out. Very high readings may mean the sensor is not working properly. |
| Sensor may be offline. Check the Air Quality Index. |
| Pilot Scales | Message |
|---|---|
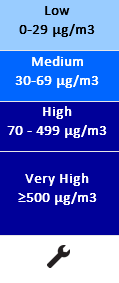
| Low 0-29 µg/m3 |
Enjoy your outdoor activities. |
| Medium 30-69 µg/m3 |
If medium readings continue (for an hour or more), use the Air Quality Index to plan outdoor activites. |
| High 70-499 µg/m3 |
You may be near a source of particle pollution like dust, smoke or exhaust. Check the air Quality Index to plan outdoor activities. |
| Very High >=500 µg/m3 |
You may be near a source of particle pollution like dust, smoke or exhaust. Check the Air Quality Index to find out if you should adjust outdoor activities. Very high readings may mean the sensor is not working properly. |
 |
Sensor may be offline. Check the Air Quality Index. |
What do the low-medium-high-very high categories mean for my health?
Air quality monitors provide a snapshot of air quality – in many cases, a 1-minute snapshot. But scientific studies don’t tell us what a single minute of exposure means for health.
While we can’t tell people what a 1-minute exposure means for their health, we understand that sensor users will want to know how minute-by-minute data might be useful for them. That led EPA to develop the sensor scale – an indication of whether air quality values fall into low, medium or high ranges for ozone or particle pollution. Used in conjunction with the Air Quality Index (AQI), the sensor readings can give you a good idea of when you may want to adjust your outdoor activities to protect your health.
What is the low-medium-high-very high scale based on?
EPA analyzed millions of air quality data points to develop the scale. The agency examined 1-minute ozone and particle pollution data from the Village Green benches, the agency’s community program to demonstrate the capabilities of new real-time monitoring technology. We also analyzed 1-minute data from regulatory monitors used by EPA and state and local air agencies, where available, along with 1-hour data for particle pollution. Specifically, we looked at the relationship between short-term air quality data (such as 1-minute and 1-hour data) and longer-term data (such as 8-hour and 24-hour data). Longer-term data are more closely related to the results of studies about the health impacts of air pollution. We used Information about those relationships helped us to identify appropriate “breakpoints” for the low, medium and high categories.
Summaries of the air quality analyses, along with details on how EPA established the breakpoints are available at http://bit.ly/VillageGreenPilot
I have my own air quality sensor. The information on it is different than the information on AirNow. Which should I rely on?
Both sensors and AirNow give you information on air quality. EPA recommends that you use AirNow for information on air quality and health. Here’s why:
- AirNow reports the current Air Quality Index (AQI) for ozone and particle pollution, two common air pollutants. The AQI is based on EPA’s National Ambient Air Quality Standards and the underlying scientific information about exposure to those pollutants and health. In addition, the monitors that report to AirNow are built and operated according to rigorous air monitoring regulations, and they provide high-quality data. Most low-cost sensors currently do not meet these same data quality standards.
- What your sensor can do is give you helpful information about short-term (such as 1-minute) air quality levels right at your location that you can use to adjust your outdoor activities. For example, do you regularly see elevated particle pollution readings on your walk to work? Move a street over, and see if they improve. If they do, you may want to change your route. Are you seeing elevated ozone readings that are lasting for a while in the afternoon? You might want to switch your afternoon run to the morning, when ozone levels typically are lower, or run on a treadmill at the gym.