About the Automotive Trends Data
Key Features of the Trends Database
- The Trends database has been maintained by EPA since 1975 and is updated annually to include the most up to date data available for all model years.
- All data are based on production volumes delivered for sale in the U.S. by model year, and may vary from publicized data based on calendar year sales.
- Data for model years 1975 through 2019 are final and based on official data submitted to EPA and NHTSA. Data for model year 2020 are preliminary and based on data provided to EPA by automakers prior to the model year, including projected production volumes.
- There are two categories of CO2 emissions and fuel economy data: compliance data and estimated real-world data. Important differences are discussed below.
- Most of the data are reported as fleetwide averages, reflecting arithmetic production-weighted averages of individual CO2 emissions values and harmonic production-weighted averages of individual fuel economy values.
- Major methodological changes are generally propagated backwards through the historical database in order to maintain the integrity of long-term trends.
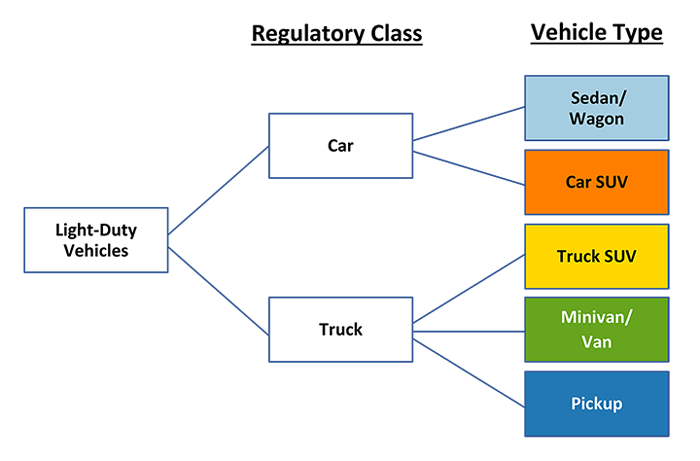
The Trends database includes all new light-duty vehicles in the United States. Under the CAFE and GHG regulations, new vehicles are separated into two distinct regulatory classes, cars and trucks, and each vehicle class has separate GHG and fuel economy standards. Pickup trucks, vans, and minivans are all considered trucks under the regulatory definitions, while sedans, coupes, and wagons are generally classified as cars. Sport utility vehicles (SUVs) however, fall into both categories. For more details, see Section 3 of the Full Report.
Regulatory Classes and Vehicle Types Used in This Report
Manufacturers included in this database use the model year 2019 manufacturer definitions determined by EPA and NHTSA for implementation of the GHG emission standards and CAFE program. When a manufacturer grouping changes under the GHG and CAFE programs, EPA applies the new manufacturer definitions to all prior model years for the analysis of estimated real-world CO2 emission and fuel economy trends. This maintains consistent manufacturer and make definitions over time, which enables better identification of long-term trends. However, the compliance data maintain the previous manufacturer definitions where necessary to preserve the integrity of compliance data as accrued.
Fuel Economy and CO2 Metrics
The carbon dioxide (CO2) emissions and fuel economy data in this report fall into one of two categories based on the purpose of the data and the subsequent required emissions test procedures.
The first category is compliance data, which is measured using laboratory tests required by law for CAFE and adopted by EPA for GHG compliance. Compliance data are measured using EPA city and highway test procedures (the “2-cycle” tests), and fleetwide averages are calculated by weighting the city and highway test results by 55% and 45%, respectively. These procedures are required for compliance; however, they no longer accurately reflect real-world driving. Compliance data may also encompass optional performance credits and adjustments that manufacturers can use towards meeting their emissions standards.
The second category is estimated real-world (previously called “adjusted”) data, which is measured using additional laboratory tests to capture a wider range of operating conditions (including hot and cold weather, higher speeds, and faster accelerations) encountered by an average driver. This expanded set of tests is referred to as “5-cycle” testing. City and highway results are weighted 43% city and 57% highway, consistent with fleetwide driver activity data. The city and highway values are the same values found on new vehicle fuel economy labels, however the label combined value is weighted 55% city and 45% highway. Unlike compliance data, the method for calculating real-world data has evolved over time, along with technology and driving habits.
| CO2 and Fuel Economy Data Category | Purpose | Current City/Highway Weighting | Current Test Procedure Basis |
|---|---|---|---|
| Compliance | Basis for manufacturer compliance with standards | 55% / 45% | 2-cycle |
| Estimated Real-world (“adjusted” in previous reports) | Best estimate of real-world performance | 43% / 57% | 5-cycle |
For additional Trends database details and methodological explanation of fuel economy and CO2 values and calculations throughout the historical database, see the Appendices to the Full Report .