Highlights of the Automotive Trends Report
On this page:
- New vehicle estimated real-world CO2 emissions increased slightly from last year’s record low
- All vehicle types are at or near record low CO2 emissions; however, market shifts away from cars and towards sport utility vehicles (SUVs) and pickups have offset some of the fleetwide benefits
- Most manufacturers have improved CO2 emissions and fuel economy over the last 5 years
- Average new vehicle horsepower continues to increase rapidly, while weight is increasing slowly
- Manufacturers continue to adopt a wide array of advanced technologies
- All fourteen large manufacturers achieved compliance with the GHG standards through model year 2019
- Most large manufacturers used banked or purchased credits to maintain compliance in model year 2019
- The overall industry used credits for the fourth year in a row to maintain compliance, but there remains a large bank of credits for future years
1. New vehicle estimated real-world CO2 emissions increased slightly from last year’s record low
Figure ES-1. Estimated Real-World Fuel Economy and CO2
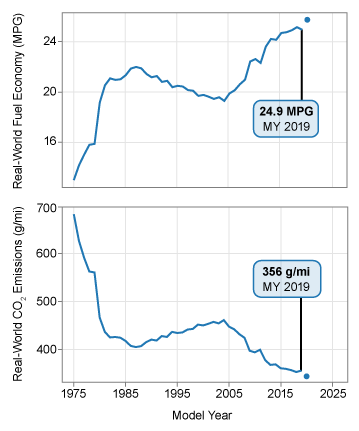
In model year 2019, the average estimated real-world CO2 emission rate for all new vehicles increased slightly (less than 1%) from the record low achieved in model year 2018. The new vehicle emission rate increased 3 g/mi to 356 g/mi. Fuel economy decreased by 0.2 miles per gallon to 24.9 mpg, or slightly below the record high achieved in model year 2018.
Since 2004, CO2 emissions have decreased 23%, or 105 g/mi, and fuel economy has increased 29%, or 5.6 mpg. Over that time, CO2 emissions and fuel economy have improved in twelve out of fifteen years. The trends in CO2 emissions and fuel economy since 1975 are shown in Figure ES-1.
Preliminary data suggest improvements in model year 2020. Average estimated real-world CO2 emissions are projected to fall 12 g/mi to 344 g/mi, and fuel economy is projected to increase 0.8 mpg to 25.7 mpg. Projected data are shown in Figure ES-1 as a dot because the values are based on manufacturer projections rather than final data.
2. All vehicle types are at or near record low CO2 emissions; however, market shifts away from cars and towards sport utility vehicles (SUVs) and pickups have offset some of the fleetwide benefits
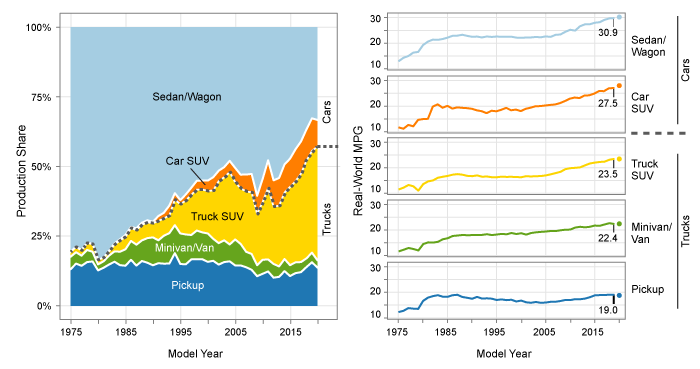
In this report, vehicles are disaggregated into five vehicle types: sedan/wagon, car SUV, truck SUV, pickup truck, and minivan/van. The distinction between car and truck SUVs is based on regulatory definitions where SUVs that are 4WD or above a weight threshold (6,000 pounds gross vehicle weight) are generally regulated as trucks and classified at truck SUVs for this report. The remaining 2WD SUVs are subject to car standards and classified as car SUVs.
All five vehicle types are at or near record high fuel economy and record low CO2 emissions in model year 2019. Truck SUVs had the largest improvement in fuel economy (0.4 mpg) and CO2 emissions (6 g/mi), followed by car SUVs and sedans/wagons. Pickups and minivans had a small drop in fuel economy and increase in CO2 emissions, but remain close to record high fuel economy and record low CO2 emissions set in model year 2018.
The overall new vehicle market continues to move away from the sedan/wagon vehicle type towards a combination of truck SUVs, car SUVs, and pickups. Sedans and wagons fell to 33% of the market, well below the 50% market share they held as recently as model year 2013, and far below the 80% market share they held in 1975. Conversely, truck SUVs reached a record 37% of the market in model year 2019, car SUVs reached a record 12% of the market, and pickups have increased in recent years to 16% of the market.
The trend away from sedans/wagons, which remain the vehicle type with the highest fuel economy and lowest CO2 emissions, and towards vehicle types with lower fuel economy and higher CO2 emissions has offset some of the fleetwide benefits that otherwise would have been achieved from the improvements within each vehicle type.
Figure ES-2. Production Share and Fuel Economy by Vehicle Type
3. Most manufacturers have improved CO2 emissions and fuel economy over the last 5 years
Manufacturer trends over the last five years are shown in Figure ES-3. This span covers the approximate length of a vehicle redesign cycle, and it is likely that most vehicles have undergone design changes in this period, resulting in a more accurate depiction of recent manufacturer trends than focusing on a single year. Changes over this time period can be attributed to both vehicle design and changing vehicle production trends.
Over the last five years, ten of the fourteen largest manufacturers selling vehicles in the U.S. decreased new vehicle estimated real-world CO2 emission rates. Between model years 2014 and 2019, Kia achieved the largest reduction in CO2 emissions, at 31 g/mi, followed by Honda and Hyundai. Tesla was unchanged because their all-electric fleet produces no tailpipe CO2 emissions. Three manufacturers increased new vehicle CO2 emission rates; Mazda had the largest increase, at 13 g/mi, followed by General Motors (GM) and Ford.
Eleven of the fourteen largest manufacturers increased fuel economy over the same period. Tesla had the largest increase in fuel economy (measured in miles per gallon of gasoline equivalent), due to the introduction of the Model 3 in model year 2017. The Model 3 is now Tesla’s most efficient and highest production vehicle. Of the remaining manufacturers, Kia had the largest increase in fuel economy, again followed by Honda and Hyundai. Fuel economy fell for three manufacturers; Mazda had the largest drop in fuel economy, followed by GM and Ford.
For model year 2019 alone, Tesla’s all-electric fleet had by far the lowest tailpipe CO2 emissions and highest fuel economy of all large manufacturers. Tesla was followed by Honda and Hyundai. Fiat Chrysler Automobiles (FCA) had the highest new vehicle average CO2 emissions and lowest fuel economy of the large manufacturers in model year 2019, followed by GM and Ford.
Figure ES-3. Changes in Estimated Real-World Fuel Economy1 and CO2 for Large Manufacturers
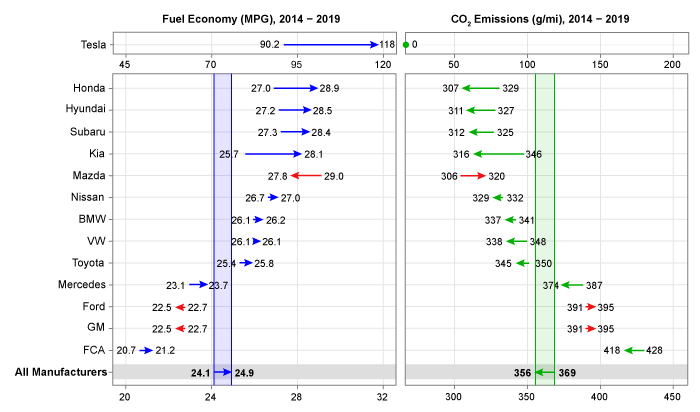
1.Electric vehicles, including Tesla’s all-electric fleet, are measured in terms of miles per gallon of gasoline equivalent, or mpge.
4. Average new vehicle horsepower continues to increase rapidly, while weight is increasing slowly
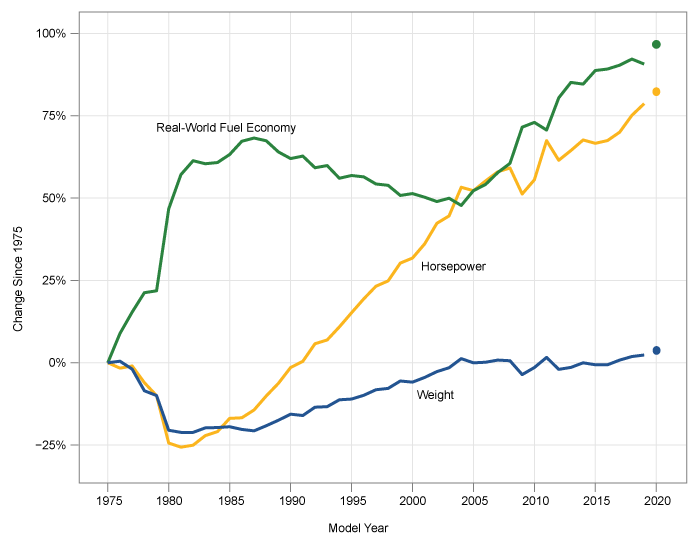
Vehicle weight and horsepower are two fundamental vehicle attributes that influence a vehicle’s CO2 emissions and fuel economy. For vehicles with internal combustion engines, increased weight or horsepower generally results in higher CO2 emissions and lower fuel economy, all else being equal. Weight is also an important metric for electric vehicles, as increased vehicle weight will generally result in lower fuel economy. However, electric vehicles produce zero tailpipe emissions regardless of weight or horsepower. Over time, automotive technology innovation has been applied to vehicle design with differing emphasis between vehicle weight, power, CO2 emissions and fuel economy (Figure ES-4).
In the two decades before model year 2004, technology innovation was generally used to increase vehicle power, and weight increased due to changing vehicle design, increased vehicle size, and increased content. During this period, average new vehicle fuel economy steadily decreased and CO2 emissions correspondingly increased. However, since model year 2004, technology has been used to increase both fuel economy (up 29%) and power (up 16%), while reducing CO2 emissions (down 23%). Average vehicle weight in model year 2019 was only slightly above 2004 but has increased slowly over the last several years and is currently at the highest point on record.
One additional vehicle metric not shown in Figure ES-4 is vehicle footprint, or the area enclosed by the four tires. Footprint is the basis for determining regulatory standards under the GHG and CAFE regulations. Since EPA began tracking footprint in model year 2008, average footprint has increased about 4%, and is at the highest point on record at 50.8 square feet.
Figure ES-4. Percent Change in Fuel Economy, Horsepower, and Weight Since 1975
5. Manufacturers continue to adopt a wide array of advanced technologies
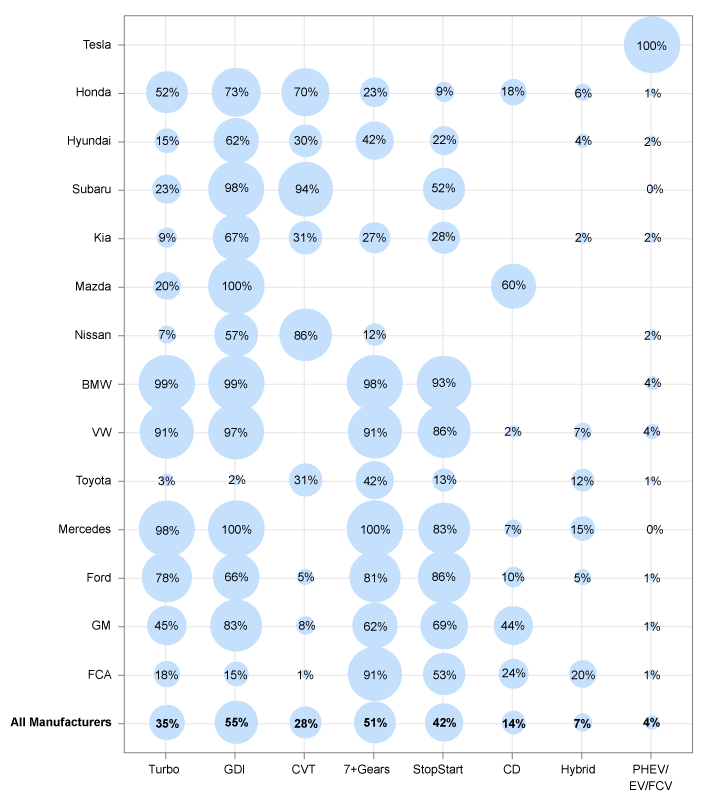
Innovation in the automobile industry has led to a wide array of technology available to manufacturers to achieve CO2 emissions, fuel economy, and performance goals. Figure ES-5 illustrates projected manufacturer-specific technology adoption, with larger circles representing higher adoption rates, for model year 2020. The figure shows preliminary model year 2020 technology projections to provide insight on a quickly changing industry, even though there is some uncertainty in the preliminary data.
Engine technologies such as turbocharged engines (Turbo) and gasoline direct injection (GDI) allow for more efficient engine design and operation. Cylinder deactivation (CD) allows for use of only a portion of the engine when less power is needed, while stop/start systems can turn off the engine entirely at idle to save fuel. Hybrid vehicles use a larger battery to recapture braking energy and provide power when necessary, allowing for a smaller, more efficiently operated engine. The hybrid category includes “full” hybrid systems that can temporarily power the vehicle without engaging the engine and smaller “mild” hybrid systems that cannot propel the vehicle on their own. Transmissions that have more gear ratios, or speeds, allow the engine to more frequently operate near peak efficiency. Two categories of advanced transmissions are shown in Figure ES-5: transmission with seven or more discrete speeds (7+Gears), and continuously variable transmissions (CVTs). Many of the technologies in Figure ES-5 have been adopted rapidly by the industry. For example, GDI was used in fewer than 3% of vehicles as recently as model year 2008 but is projected to be in more than 55% of vehicles in model year 2020. Electric vehicles (EVs), plug-in hybrid vehicles (PHEVs), and fuel cell vehicles (FCVs) are a small but growing percentage of new vehicles.
Figure ES-5. Technology Share for Large Manufacturers, Model Year 2020
6. All fourteen large manufacturers achieved compliance with the GHG standards through model year 2019
EPA’s GHG program is an averaging, banking, and trading (ABT) program. An ABT program means that the standards may be met on a fleet average basis, manufacturers may earn and bank credits to use later, and manufacturers may trade credits with other manufacturers. This provides manufacturers flexibility in meeting the standards while accounting for vehicle design cycles, introduction rates of new technologies and emission improvements, and evolving consumer preferences.
Figure ES-6. GHG Credit Balance for Large Manufacturers, after Model Year 2019
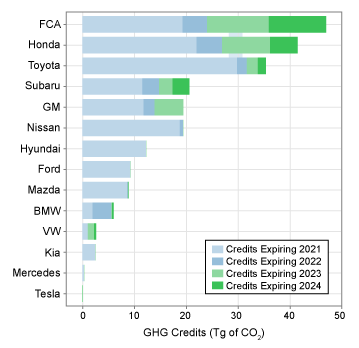
Within a model year, manufacturers with average fleet emissions lower than the standards generate credits, and manufacturers with average fleet emissions higher than the standards generate deficits. Any manufacturer with a deficit at the end of the model year has up to three years to offset the deficit with credits earned in future model years, or purchased from another manufacturer. Because credits may not be carried forward unless deficits from all prior model years have been resolved, a positive credit balance means compliance with the current and all previous model years of the program.
The fourteen largest manufacturers ended model year 2019 with a positive credit balance and are thus in compliance for model year 2019 and all previous years of the GHG program. The accumulated credits shown in Figure ES-6 will be carried forward for use in future model years. Total credits are shown in teragrams (one million Megagrams), and account for manufacturer performance compared to their standards, expected vehicle lifetime miles driven, and the number of vehicles produced by each manufacturer, for all years of the GHG program.
7. Most large manufacturers used banked or purchased credits to maintain compliance in model year 2019
Manufacturers used different combinations of technology improvements, banked credits, and purchased credits to achieve compliance in 2019. Tesla, Honda, and Subaru achieved compliance based on the emission performance of their vehicles, without requiring additional banked credits. All other large manufacturers used banked or purchased credits, along with technology improvements, to achieve compliance in model year 2019.
Figure ES-7 illustrates the performance of individual large manufacturers in model year 2019 compared to their overall standard, in terms of an average vehicle grams per mile emission rate. This “snapshot” provides insight into how the large manufacturers performed against the standards in model year 2019. However, it does not account for the fact that all large manufacturers had credits available from previous years, or they were able to purchase credits to ensure their credit balance remained positive after model year 2019.
Figure ES-7. CO2 Performance and Standards by Manufacturer, Model Year 2019
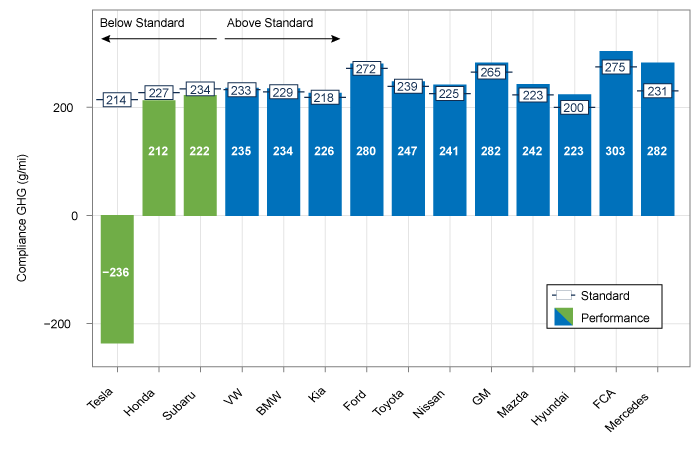
The regulations include an incentive multiplier that allowed each 2019 model year electric vehicle to be counted as two. The impact of this incentive is particularly evident for Tesla, because Tesla produces only electric vehicles. Before including the multiplier, Tesla’s model year 2019 performance value was -22 g/mi, due to their 0 g/mi tailpipe emissions and 22 g/mi of air conditioning and off-cycle credits. The multiplier lowered Tesla’s performance value another 214 g/mi, which is equivalent to the difference between Tesla’s standard and tailpipe emissions, resulting in a performance value of -236 g/mi, as shown in Figure ES-7.
8. The overall industry used credits for the fourth year in a row to maintain compliance, but there remains a large bank of credits for future years
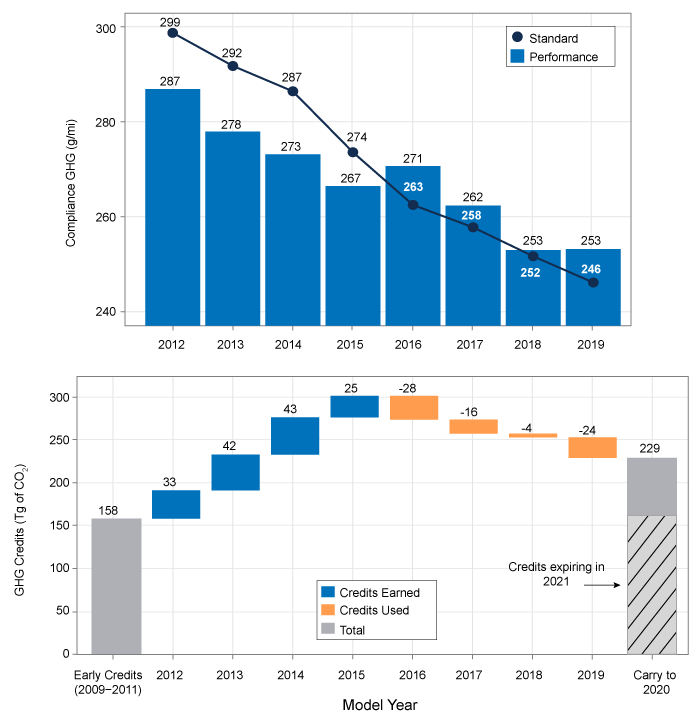
Under the GHG Program, manufacturers were able to accrue “early credits,” before the GHG standards took effect in model year 2012, for early deployment of efficient vehicles and technology. For the next four years, manufacturers continued to generate credits, as the industry GHG performance was below the industry-wide average standard. In the last four years, the industry GHG performance has been above the industry-wide average standard, resulting in net withdrawals from the bank of credits to maintain compliance. In model year 2019, the industry maintained overall GHG performance at 253 g/mi, while the standard fell from 252 g/mi to 246 g/mi. The gap between the standard and GHG performance grew from 1 g/mi in model year 2018 to 7 g/mi in model year 2019. To maintain compliance the industry drew down their industry-wide total credit bank by about 24 Tg, which was less than 10% of the total available credit balance. The overall industry emerged from model year 2019 with a bank of more than 229 teragrams (Tg) of GHG credits available for future use, as seen in Figure ES-8.
In addition to the balance of the industry-wide bank, the expiration date and distribution of credits are also important factors. Credits earned in model year 2017 or beyond have a five-year life, while all prior credits (two-thirds of the current bank) will expire at the end of model year 2021. At the present time, an active credit market is enabling manufacturers to purchase credits to demonstrate compliance, with eight manufacturers selling credits, ten manufacturers purchasing credits, and approximately 70 credit trades since 2012. However, the availability of current or future credits is inherently uncertain.
Figure ES-8. Industry Performance and Standards, Credit Generation and Use
See the Executive Summary for a PDF version of the Highlights.