How BenMAP-CE Estimates the Health and Economic Effects of Air Pollution
What are the health impacts associated with poor air quality?
The BenMAP-CE tool estimates the number and economic value of heath impacts resulting from changes in air quality - specifically, ground-level ozone and fine particles. Before describing how BenMAP-CE calculates impacts and economic values, it is helpful to first understand how air pollution affects health.
Fine particles can enter deep into the lungs and enter the blood stream. Health impacts from particles include:
- Premature death
- Non-fatal heart attacks
- Aggravated asthma
Ground-level ozone is an oxidant that can irritate airways in the lungs. Health impacts form ozone include:
- Premature death
- Aggravated asthma
- Lost days of school
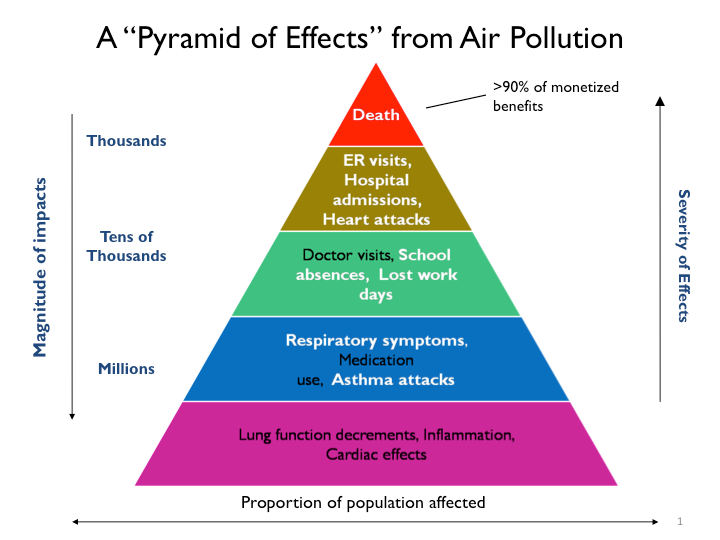
The pyramid above describes how the incidence, and severity, of fine particle and ozone-related health impacts are related. Health outcomes toward the bottom of the pyramid like asthma attacks and cardiac effects are less severe, and affect a larger proportion of the population. Impacts toward the tip of the pyramid like hospital admissions and heart attacks are more severe and affect a smaller proportion of the population. BenMAP-CE quantifies those impacts shown in white.
How does BenMAP-CE estimate health impacts?
A health impact function incorporates four key sources of data: BenMAP-CE uses "health impact functions" that are constructed using information from the published epidemiology literature.
- modeled or monitored air quality changes;
- population;
- baseline incidence rates;
- an effect estimate.
The figure below describes the data BenMAP-CE uses to calculate health impacts.
How does BenMAP-CE calculate economic values?
The program calculates the economic value of air quality change using both “Cost of Illness” and “Willingness to Pay” metrics. The Cost of Illness metric summarizes the expenses that an individual must bear for air pollution-related hospital admissions, visits to the emergency department and other outcomes; this metric includes the value of medical expenses and lost work, but not the value that individuals place on pain and suffering associated with the event. By contrast, Willingness to Pay metrics are understood to account for the direct costs noted above as well as the value that individuals place on pain and suffering, loss of satisfaction and leisure time.
This simple example summarizes the procedure for calculating economic values using these two metrics in BenMAP-CE. Find out more about the assumptions at Applications: Articles and Presentations.


