Download R Scripts and Sample Data
How to Download R Scripts and Sample Data
This section is provided for users who are very comfortable with R and who wish to download scripts directly. For novice R users, please note that the web pages in the Helpful Links box have additional information that will help you successfully run the script.
R scripts from this section can be saved directly on your hard drive as an ".R" file. Each script can be then run by executing the following command in R:
source(filename)
For example,
source("weighted.average.R")
The scripts listed below assume that data have been downloaded and stored in the working directory. Before running any of the other analysis programs, the first script listed (Set Up Variables) should be run to set up R data files.
- Set Up Variables
- Calculate Weighted Average Tolerance Values
- Compute Cumulative Percentiles
- Parametric Regression
- Non-Parametric Regression
- Chi-Square Tests for Parametric and Non-parametric Models
- Compute Area Under ROC Curve
- Classify Response Shape
- Compare Taxa Names in Tolerance Value and Assessment Data
- Calculate Weighted Average Inferences
To estimate multivariate taxon-environment relationships, or to format any taxon-environment relationship correctly for maximum likelihood inferences, you will need to use the scripts provided in the R library bio.infer. The library also contains the script that computes maximum likelihood inference and other tools.
The library can be installed by typing at the R prompt:
install.packages("bio.infer")
Sample Data
Two sample data sets are provided here to illustrate the analysis methods described in this module. The first data set was collected by U.S. Environmental Protection Agency's Environmental Management and Assessment Program-Western Pilot Project (EMAP-West) from 2000 to 2002, and the second data set was collected in western Oregon by the Oregon Department of Environmental Quality (DEQ) from 1999 to 2000 (Figures 22 and 23). Both organizations used a similar sampling protocol. A reach 40 times the wetted width of the stream was delineated for sampling. Stream temperature was measured at the time of sampling. Substrate composition was estimated by summarizing the size distribution of particles at five locations on 21 transects. For the EMAP-West, macroinvertebrate samples were collected at eight randomized locations in riffles using a modified D-frame kicknet (500 µm mesh) by disturbing a 1 ft² area for 30 seconds. In Oregon, samples were collected by disturbing 2 ft² areas at four randomized locations. Samples from both studies were composited and spread on a gridded pan and picked from randomly selected grid squares until at least 500 organisms were collected. Each organism was then identified to the lowest possible taxonomic level (usually genus or species).
- Site-species data: EMAP-West(10 pp, 354 K)
- Environmental data: EMAP-West(10 pp, 19 K)
- Site-species data: Western Oregon(10 pp, 199 K)
- Environmental data: Western Oregon(10 pp, 5 K)
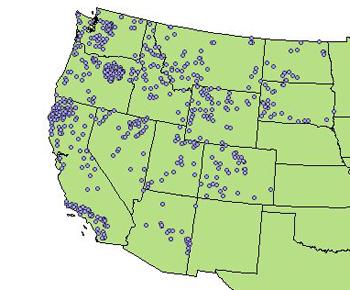 Figure 22. Sample locations for EMAP-West.
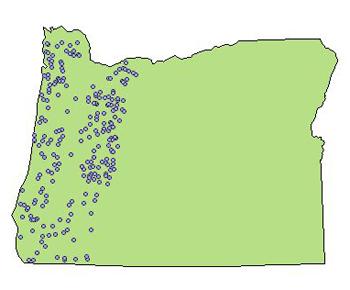 Figure 23. Sample locations for western Oregon.