AQUATOX Features and Tools
AQUATOX has been designed to be user-friendly and to provide maximum flexibility. Numerous features have been included to facilitate the modeling process, from model setup and data input, presentation and analysis of results, to easy export of results to spreadsheet programs for additional analysis. This is especially true for Release 3.1.
Model setup
AQUATOX is designed to provide maximum control and flexibility in model setup.
- Windows-based (Windows 7, 8, Vista, XP, NT, 2000 or 98)
- Note: For optimal performance, Windows 7, 8, XP or Vista is recommended.
- 64-bit OS compatible
- Intuitive user interface
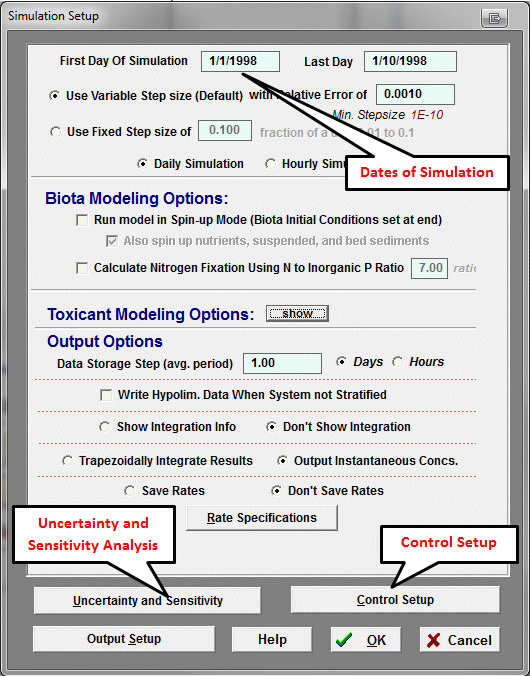
- Control setup allows development of scenarios and management alternatives
- Option to run "control" vs. "perturbed" simulations to isolate effects of a given stressor
- No limits on length of simulation period
- Variable time step for efficiency and fixed time step for precise comparisons of control and perturbed simulations
- Modular design provides extensive control over choice of state variables
- The AQUATOX Wizard helps guide user through the study setup
- Context-sensitive Help files
Data input
AQUATOX is designed to provide a realistic representation of aquatic ecosystems with a minimal amount of detailed site-specific information or site calibration.
AQUATOX can accept input data in a wide variety of formats and sources.
Required input data
- Environmental Data:
- Loadings to the waterbody
- General site characteristics
- Biological and Chemical Parameters:
- Biological characteristics of the plants and animals
- Chemical characteristics of any organic toxicant
AQUATOX comes bundled with data libraries that provide default data and parameter sets for different waterbody types, animal and plant species, and chemicals. This is of particular importance for the biological parameters, which are probably the most difficult for a user to obtain. Also included are multiple example applications that can be used as a starting point for a new application by modifying just those characteristics or parameters that differ from the original. We continue to add to these libraries to expand the range of site types, ecological communities and pollutant types.
AQUATOX can link to BASINS, EPA's GIS and water quality modeling system. This allows one to take pollutant loading predictions from the HSPF watershed model within BASINS and input them directly to AQUATOX. Newly added to Release 3.1 is the option to import data from the standalone version of HPSF.
Environmental loadings can be from multiple sources
- Point or nonpoint sources
- Upstream contributions
- Atmospheric deposition
- Groundwater and tributaries
All loadings may be constant or time variable. Acceptable formats for input data include Excel (*.xls*), tab-delimited (*.txt), comma-delimited (*.csv), Dbase (*.dbf), and Paradox (*.db).
Model output and analysis of results
AQUATOX provides output in terms of time-varying biomass of the various plants and animal, chemical concentrations in water, and concentrations of the organic toxicant in water, organic sediments and biota. It has numerous features to assist in the display and analysis of results:
- Calculation of biological and ecological metrics, such as %EPT (Ephemeroptera, Plecoptera, Trichoptera), % cyanobacteria, periphytic chlorophyll a, TSI (Trophic State Index), and GPP (Gross Primary Productivity)
- Option to save and graph time-varying rates, such as consumption, photosynthesis, and limitation factors on photosynthesis
- Calculation of tissue concentrations and bioaccumulation factors for organic toxicants
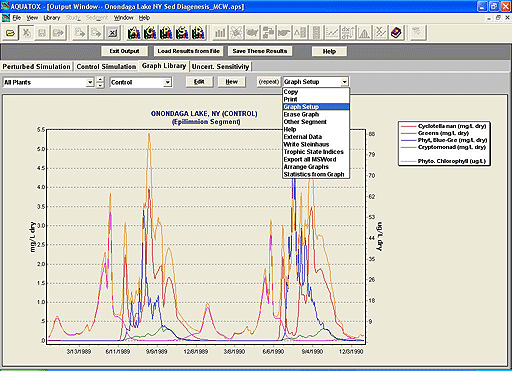
- Powerful graphing capability
- Default graph library
- X-Y plots, duration and frequency graphs and scatter plots
- Import of observed data to facilitate calibration
- Easy export to Microsoft EXCEL
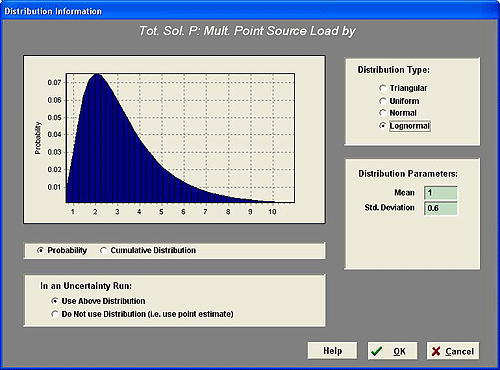
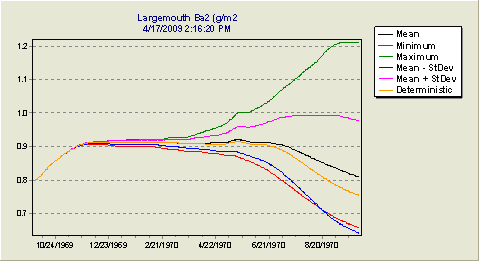
- Automated nominal range sensitivity analysis, statistical sensitivity analysis, and uncertainty analysis
Sensitivity and Uncertainty Analysis
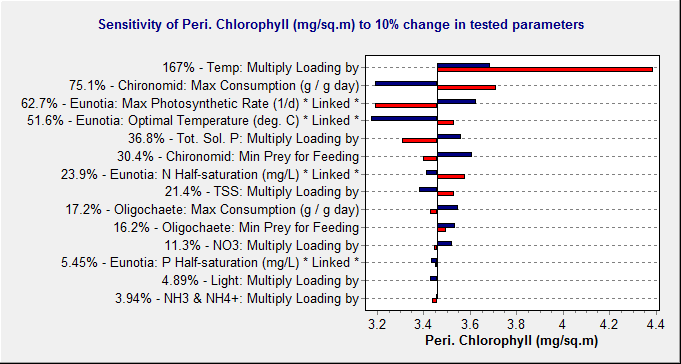
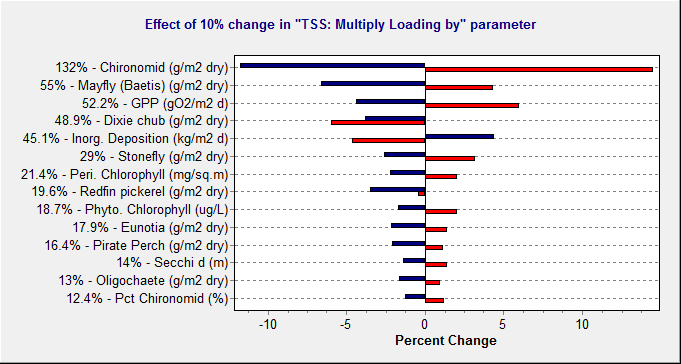
There are many sources of variability and uncertainty when modeling ecosystems. AQUATOX 3.1 includes a built-in nominal range sensitivity analysis (Frey and Patil 2001), which may be used to examine the sensitivity of multiple model outputs to multiple model parameters; the parameters producing the most sensitivity can be compared by means of the automated "tornado diagrams". A user can also set up a reverse tornado diagram in which the effects of a change in a single parameter on all tracked outputs can be examined.
AQUATOX also allows the user to quantify and evaluate model uncertainty by varying the values or statistical distributions of multiple input parameters simultaneously. Likewise, statistical sensitivity analyses can be performed using statistical distributions for input parameters one at a time.
