ToxCast Data Generation: ToxCast Pipeline (tcpl)
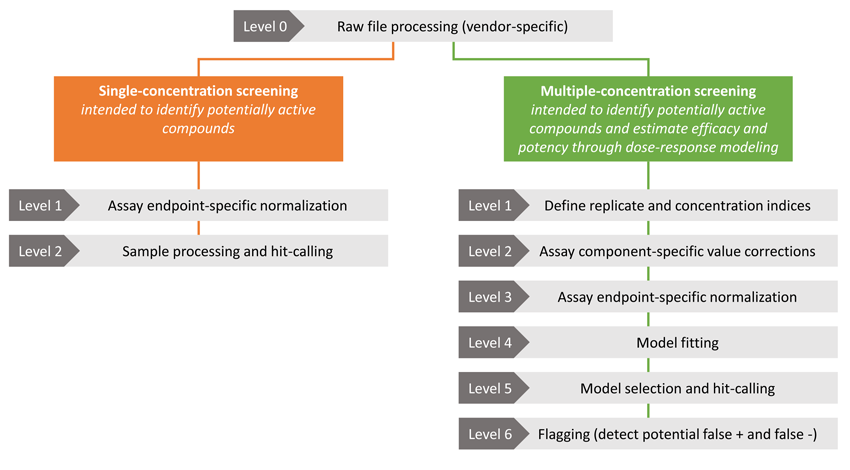
The ToxCast pipeline (tcpl) is an R package (R Core Team, 2016) that provides storage, normalization, dose-response modeling and visualization solutions for HTS screening efforts. The tcpl package provides functionality for two screening paradigms:
- single-concentration screening, intended to only identify potentially active compounds, and
- multiple-concentration screening intended to identify potentially active compounds and estimate the efficacy and potency through dose-response modeling
Based on the screening paradigm, the package processes data through a set of Levels as outlined in the figure below. The tcpl database stores the same raw information at Level 0 for each screening paradigm. To address both data storage and reproducibility issues the tcpl package interacts with a MySQL relational database to store all data and processing decisions made by the user. In addition to storing the data at every level of processing, the accompanying database stores chemical and assay annotations to facilitate further analyses and disseminating results.
The final processed data, including hit calls, can be found on the ToxCast Data Download website.
For more details on downloading and using the tcpl, please click here. Detailed information about all processing steps is included in the package vignette.
Data Analysis Pipeline Overview
Dose-Response Modeling
The dose-response modeling procedure was designed to handle the outliers and cytotoxicity-related loss of signal common to HTS efforts. The modeling methodology evaluates each data series with three models: (i) a constant model at zero (orange in figure), (ii) a constrained three-parameter Hill model (blue) and (iii) a constrained five-parameter gain-loss model (red).
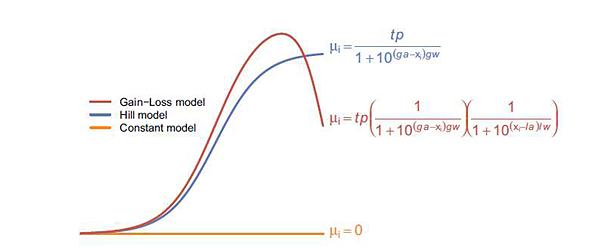
To facilitate simple cross-experiment comparisons and reduce the parameter space, dose-response modeling is constrained to a zero-centered, positive response paradigm. Therefore, negative response data requires an inverse transformation during the normalization process. To obtain robust results without removing any data, we define the log-likelihood using a Student’s t-distribution with 4 degrees of freedom (Lange et al., 1989). Utilizing the Student’s t-distribution and the gain-loss model provide robust solutions to the problems of outliers and the cytotoxicity-related signal loss that commonly occurs at high concentrations. After fitting each model, the model with the lowest Akaike information criterion value is selected as the ‘winning’ model.
Hit-Calling and Point-of-Departure Estimates
A dose-response series must meet three criteria to have an active hit call: (i) the Hill or Gain-Loss model must win and (ii) the modeled curve fit top must exceed the efficacy cutoff, and (iii) for at least one concentration the median response value must also exceed the efficacy cutoff. The efficacy cutoff is a user-defined value selected from an expandable list of methods at Level 5.
In addition to the standard AC50 (activity concentration at 50% of maximal activity) provided for the Hill and Gain-Loss models, the tcpl package provides three point-of-departure (POD) estimates for the winning model. The AC10, or activity concentration at 10%, is derived solely from the model parameters. Conversely, the ACB (activity concentration at baseline) and ACC (activity concentration at cutoff) are based on levels of noise and significance, respectively.
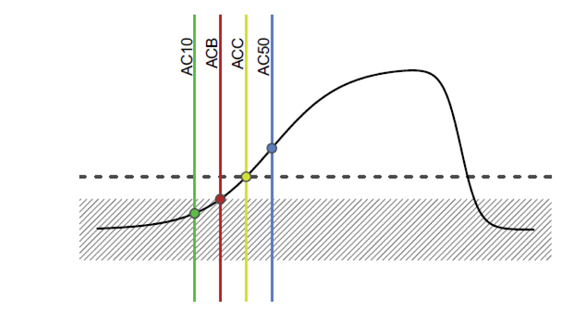
The package estimates the noise of an assay by calculating the median absolute deviation over all response values given by the first two concentrations (bmad). The baseline region is then defined as 0±3bmad, and the ACB is the concentration at which the model first reaches 3bmad. Similarly, the ACC is the concentration at which the model first reaches the user-defined cutoff value for a data-series to be considered active. The four POD estimates are illustrated in the figure.
No POD estimates are calculated when the constant model is the selected model winner, because the POD estimates do not apply.