Climate Action Benefits: Air Quality

Changes in climate are projected to affect air quality across the U.S. In already polluted areas, warmer temperatures are anticipated to increase ground-level ozone (O3), a component of smog, and increase the number of days with poor air quality.5 Changes in weather patterns may also affect concentrations of fine particulate matter (PM2.5), a mixture of particles smaller than 2.5 micrograms per cubic meter
(μg m-3), emitted from power plants, vehicles, and wildfires. Inhaling ozone and fine particulate matter can lead to a broad range of adverse health effects, including premature mortality and aggravation of cardiovascular and respiratory disease.6,7
On this page:
- Key findings
- Risks of inaction
- Reducing impacts through GHG mitigation
- Treatment of co-benefits
- Approach
Additional information:
Key Findings
- Unmitigated climate change is projected to worsen air quality across large regions of the U.S., especially in eastern, midwestern, and southern states. Impacts on ozone and fine particulate matter pollution are projected to be especially significant for densely-populated areas. The analysis holds emissions of traditional air pollutants constant at current levels to isolate the climate change related impact on air quality.
- Global GHG mitigation is projected to reduce the impact of climate change on air quality and the corresponding adverse health effects related to air pollution. Mitigation is estimated to result in significant public health benefits in the U.S., such as avoiding 13,000 premature deaths in 2050 and 57,000 premature deaths in 2100. Economic benefits to the U.S. of avoided premature deaths are estimated at $160 billion in 2050, and $930 billion in 2100.
Risks of Inaction
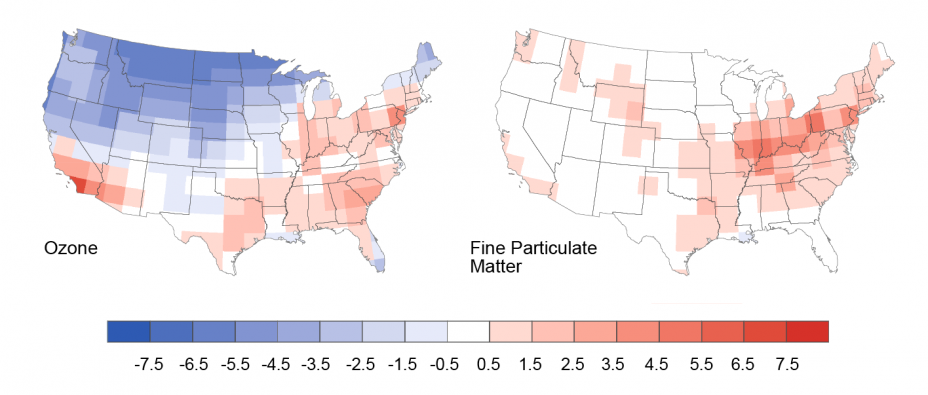
Without global GHG mitigation, climate change is projected to have a substantial effect on air quality across the contiguous U.S., with important regional differences (Figure 1). Ozone concentrations are projected to increase in the Reference scenario in more densely-populated regions, such as the East, Midwest, and South, while some less densely-populated areas experience decreases in ozone concentrations.8 Although the national annual average ozone concentration is projected to decrease slightly (1.3 ppb +/- 0.2) by 2100, human exposure to ozone is projected to increase, driven by increasing concentrations in densely-populated areas. Climate-driven ozone increases are especially substantial during summer months. By 2100, the U.S.-average 8-hour-maximum ozone concentration in June-August is projected to increase 4.7 ppb (95% confidence interval ± 0.5).9
Unmitigated climate change is projected to exacerbate fine particulate matter pollution, especially in the Midwest and East. The annual U.S.-average PM2.5 concentrations are projected to increase by 0.3 μg m-3 (± 0.1) in 2050 and 0.7 μg m-3 (± 0.1) in 2100 in the Reference scenario.10
Projections that climate change will lead to increased ozone in polluted regions are consistent with the assessment literature. There is less agreement regarding the magnitude of climate change effects on particulate matter, with the exception of increasing wildfire activity on particulates.11 The results presented in this report add to this emerging area of research.
Figure 1. Projected Impacts of Unmitigated Climate Change on Air Pollution in the U.S.
 Estimated change in annual-average ground-level hourly ozone (O3, ppb) and fine particulate matter (PM2.5, μg m-3) from 2000 to 2100 under the Reference scenario.
download the figure; download the data
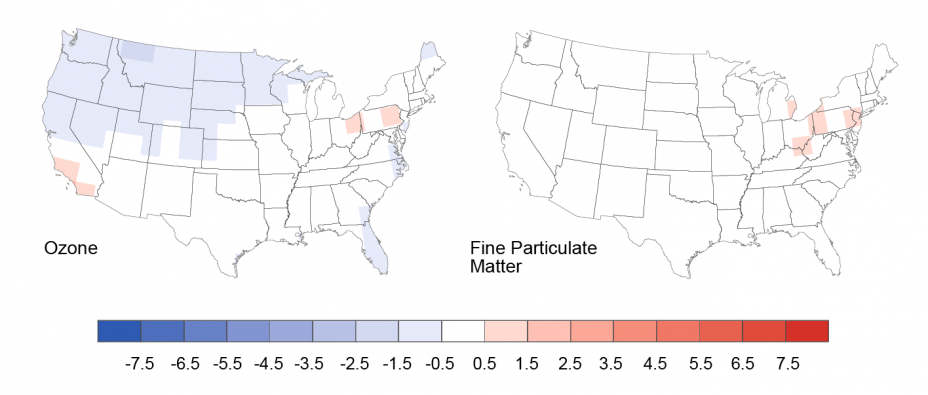
Figure 2. Projected Impacts on Air Pollution in the U.S. with Global GHG Mitigation
 Estimated change in annual-average ground-level hourly ozone (O3, ppb) and fine particulate matter (PM2.5, μg m-3) from 2000 to 2100 under the Mitigation scenario.
download the figure; download the data
Reducing Impacts through GHG Mitigation
Global GHG mitigation is projected to avoid significant adverse impacts to air quality that would occur under the Reference scenario in densely-populated areas. Figure 2 shows air quality changes in the Mitigation scenario, which are much smaller than those under the Reference (Figure 1). Despite smaller reductions in ozone in some less densely-populated areas, global GHG mitigation is projected to reduce the increase in the annual-average, 8-hour-maximum, population-weighted ozone concentration by approximately 2.6 ppb (95% confidence interval ± 0.3) that would occur in the Reference in the U.S.
Global GHG mitigation is also projected to lessen the adverse effects of climate change on fine particulate matter pollution in the U.S. In 2100, the increase in the annual-average population-weighted PM2.5 concentration under the Reference is reduced by approximately 1.2 μg m-3 (± 0.1) under the Mitigation scenario.
Reducing the impacts of climate change on air quality through global GHG mitigation is projected to result in significant health benefits across the U.S. For example, the Mitigation scenario is estimated to prevent an estimated 13,000 premature deaths in 2050 (95% confidence interval of 4,800-22,000) and 57,000 premature deaths in 2100 (95% confidence interval of 21,000-95,000) compared to the Reference.12 Economic benefits to the U.S. of these avoided deaths are estimated at $160 billion and $930 billion in 2050 and 2100, respectively. In addition to reducing premature mortality, global GHG mitigation would result in other health benefits not presented here, including reduced respiratory- and cardiovascular-related hospital admissions.13, 14
Treatment of Co-Benefits
This analysis does not quantify the additional benefits to air quality and health that would stem from simultaneous reductions in traditional air pollutants along with GHG emissions (both are emitted from many of the same sources). Incorporating these “co-benefits,” which recent analyses15 and assessments16 indicate could provide large, near-term benefits to human health, would result in a more comprehensive understanding of air quality and climate interactions.
Approach
The CIRA analysis assesses the impact of climate change on air quality across the contiguous U.S. through changes in ground-level ozone and fine particulate matter (PM2.5) concentrations.17 Future concentrations of these pollutants are simulated in an atmospheric chemistry model, driven by weather patterns from the CIRA climate projections. The analysis projects future concentrations for five initializations of the IGSM-CAM climate model under the Reference and Mitigation scenarios in 30-year periods centered on 2050 and 2100 (with 95% confidence intervals based on the difference in mean across the initializations). Despite assumptions about growth in GHG emissions in the Reference and Mitigation scenarios, emissions of the traditional air pollutants are kept fixed at present-day levels to isolate the climate change-related impact on air quality. Changes in pollution due to projected increases in wildfires and changes in sea salt and dust are not considered. Pollutant concentrations are used to estimate changes in air pollution exposure in people. The Environmental Benefits Mapping and Analysis Program (BenMAP) is applied to estimate health effects (with 95% confidence interval based on concentration response functions in BenMAP).18 To monetize the effects of changing mortality, a value of statistical life (VSL) of $9.45 million for 2010 (2014$) is used, adjusted to future years by assuming an elasticity of VSL to gross domestic product (GDP) per capita of 0.4.19
For more information on the approach, models used, and results for the air quality sector, please refer to Garcia-Menendez et al. (2015).20
