Climate Action Benefits: Bridges

Road bridges are a central component of the U.S. transportation system. With the average U.S. bridge now over 40 years old, however, more than 250 million vehicles cross structurally deficient bridges on a daily basis.5 Similar to other transportation infrastructure, bridges are vulnerable to a range of threats from climate change.6 Currently, most bridge failures are caused by scour, where swiftly moving water removes sediment from around bridge structural supports, weakening or destroying their foundations. Increased flooding and long-term river flow changes caused by climate change are expected to increase the frequency of bridge scour, further stressing the aging U.S. transportation system.
On this page:
Additional information:
Key Findings
- Without reductions in global GHG emissions, an estimated 190,000 inland bridges across the nation will be structurally vulnerable because of climate change by the end of the century. In some areas, more than 50% of bridges are projected to be vulnerable as a result of unmitigated climate change. This analysis estimates the damages of climate change in terms of increased costs to maintain current levels of service (i.e. adaptation costs). Without adaptation, climate change could render many bridges unusable, leading to large economic damages.
- Global GHG mitigation is estimated to substantially reduce the number of bridges across the U.S. that become vulnerable in the 21st century by reducing the projected increase in peak river flows under the Reference scenario.
- Global GHG mitigation is projected to reduce adaptation costs that would be incurred under the Reference scenario. The benefits of global GHG mitigation are estimated at $3.4-$42 billion from 2010-2050 and $10-$15 billion from 2051-2100 (discounted at 3%).
Risks of Inaction
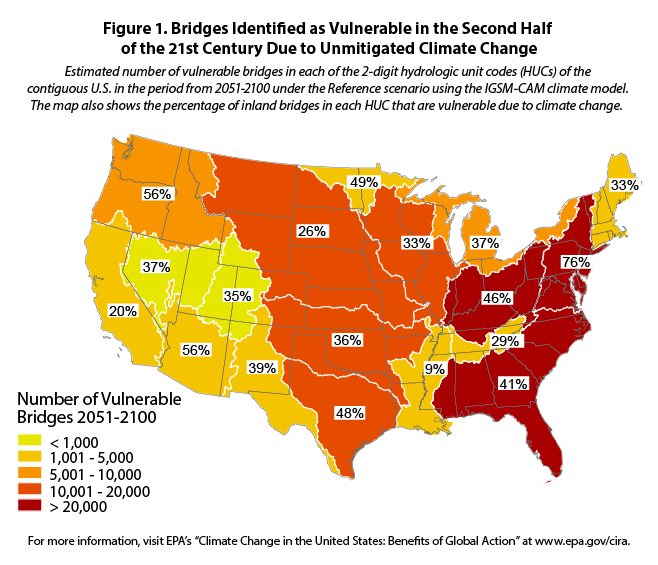
Increased inland flooding caused by climate change threatens bridges across the U.S. and risks a net increase in maintenance costs. Figure 1 shows the number and percent of bridges in each hydrologic region of the contiguous U.S. identified as vulnerable to climate change in the late 21st century under the Reference scenario using the IGSM-CAM climate model. In total, approximately 190,000 bridges are identified as vulnerable. In addition, the costs of adapting bridges to climate change under the Reference scenario are estimated at $170 billion for the period from 2010 to 2050, and $24 billion for the period from 2051 to 2100 (discounted at 3%). The higher costs during the first half of the century are primarily due to the large number of vulnerable bridges that require strengthening in the near term in the face of increasing peak river flows due to climate change. These findings regarding near-term bridge vulnerability and adaptation costs due to unmitigated climate change are consistent with the findings of the assessment literature.7
Figure 1. Bridges Identified as Vulnerable in the Second Half of the 21st Century Due to Unmitigated Climate Change
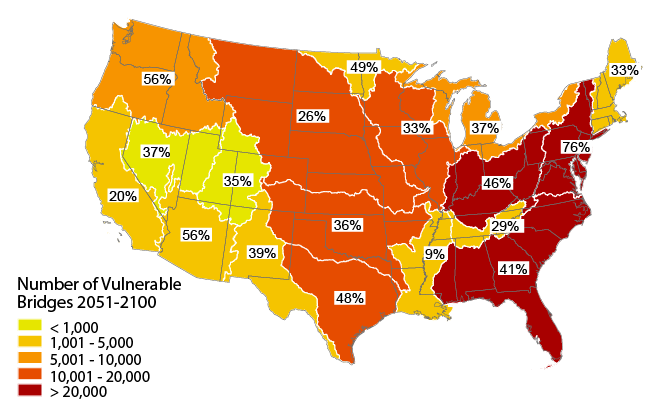 Estimated number of vulnerable bridges in each of the 2-digit hydrologic unit codes (HUCs) of the contiguous U.S. in the period from 2051-2100 under the Reference scenario using the IGSM-CAM climate model. The map also shows the percentage of inland bridges in each HUC that are vulnerable due to climate change.
 download the figure; download the data
Figure 2. Bridges Identified as Vulnerable in the Second Half of the 21st Century with Global GHG Mitigation
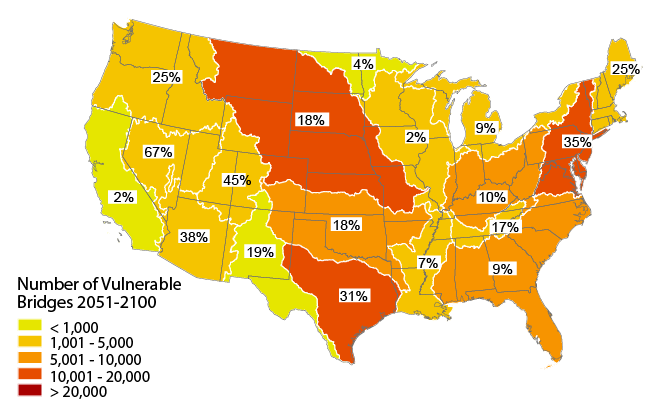 Estimated number of vulnerable bridges in each of the 2-digit HUCs of the contiguous U.S. in the period from 2051-2100 under the Mitigation scenario using the IGSM-CAM climate model. The map also shows the percentage of inland bridges in each HUC that are vulnerable due to climate change.
 download the figure; download the data
Reducing Impacts through GHG Mitigation
As shown in Figure 2, global GHG mitigation is projected to substantially reduce the number of vulnerable bridges in many areas of the contiguous U.S. compared to the Reference scenario (Figure 1). For example, the percentage of vulnerable bridges in the Northwest region, which includes Washington and parts of Oregon and Idaho, is reduced from 56% under the Reference to 25% under the Mitigation scenario. At the national scale, the total number of vulnerable bridges is reduced by roughly 40,000 through 2050 compared to the Reference scenario, and by over 110,000 in the second half of the century.
In addition, the analysis estimates that global GHG mitigation reduces the costs of adaptation substantially relative to the Reference scenario. In the period from 2010 to 2050, costs under the Mitigation scenario are approximately $42 billion lower than under the Reference (discounted at 3%). Although adaptation costs are lower in the second half of the century, costs under the Mitigation scenario are nearly 60% lower than they are under the Reference scenario, with savings estimated at $15 billion (discounted at 3%). These results rely upon climate projections using the IGSM-CAM, which projects a relatively wetter future for most of the U.S. compared to the MIROC climate model (see the Levels of Certainty section of this report for more information). The projected benefits of global GHG mitigation are lower with the drier MIROC model (not shown) for the 2010-2050 period, at approximately $3.4 billion, but are higher in the 2051-2100 period, at approximately $10 billion (discounted at 3%).
Approach
The CIRA analysis identifies inland bridges in the contiguous U.S. that may be vulnerable to increased peak river flows due to climate change and estimates the costs to adapt the at-risk infrastructure.8 The analysis relies upon climate projections from two climate models: IGSM-CAM, which projects a relatively wetter future for most of the U.S., and the drier MIROC model. Bridge performance and vulnerability are determined using the National Bridge Inventory database and are based on the following four elements:
- substructure condition;
- channel and channel protection condition;
- waterway adequacy; and
- vulnerability to scour.
The analysis estimates the timing of bridge vulnerability (based on the 100-year, 24-hour storm event), and the adaptation costs of maintaining the current condition and level of service of the at-risk bridges. Two types of bridge fortification and the costs of their implementation are analyzed: the use of riprap (large rocks and rubble) to stabilize bridge foundations and the use of additional concrete to strengthen bridge piers and abutments. Although there will likely be significant changes to the nation’s bridges over the course of the century—some bridges will be strengthened, some will deteriorate, some will be removed, and new bridges will be built—this analysis estimates the costs of adapting the nation’s existing bridge infrastructure to different future climates based on its current state (i.e., the additional costs due to climate change are isolated).9,10
For more information on the CIRA approach and results for the bridges sector, please refer to Neumann et al. (2014)11 and Wright et al. (2012).12