Climate Action Benefits: Water Quality

Climate change is likely to have far-reaching effects on water quality in the U.S. due to increases in river and lake temperatures and changes in the magnitude and seasonality of river flows, both of which will affect the concentration of water pollutants. These physical impacts on water quality will also have potentially substantial economic impacts, since water quality is valued for drinking water and recreational and commercial activities such as boating, swimming, and fishing.40,41 The analysis presented in this section estimates changes in water quality, but does not quantify the resulting health effects.
On this page:
Additional information:
Key Findings
- Unmitigated climate change is projected to have negative impacts on water quality in the U.S., particularly in the Southwest and parts of Texas.
- Global GHG mitigation is projected to prevent many of the water quality damages estimated under the Reference scenario, primarily by reducing the warming of water bodies across the country.
- Under the Mitigation scenario, costs associated with decreased water quality are reduced approximately 82% in 2100 compared to the Reference, corresponding to cost savings of approximately $2.6-$3.0 billion.
Risks of Inaction
Unmitigated climate change is projected to decrease water quality in the U.S. compared to a future with no climate change. The Water Quality Index (WQI) calculated in the CIRA analysis includes several key water quality constituents, including temperature, dissolved oxygen, total nitrogen, and total phosphorus.42 The WQI serves as a measure of water quality; the higher the WQI, the higher the water quality.
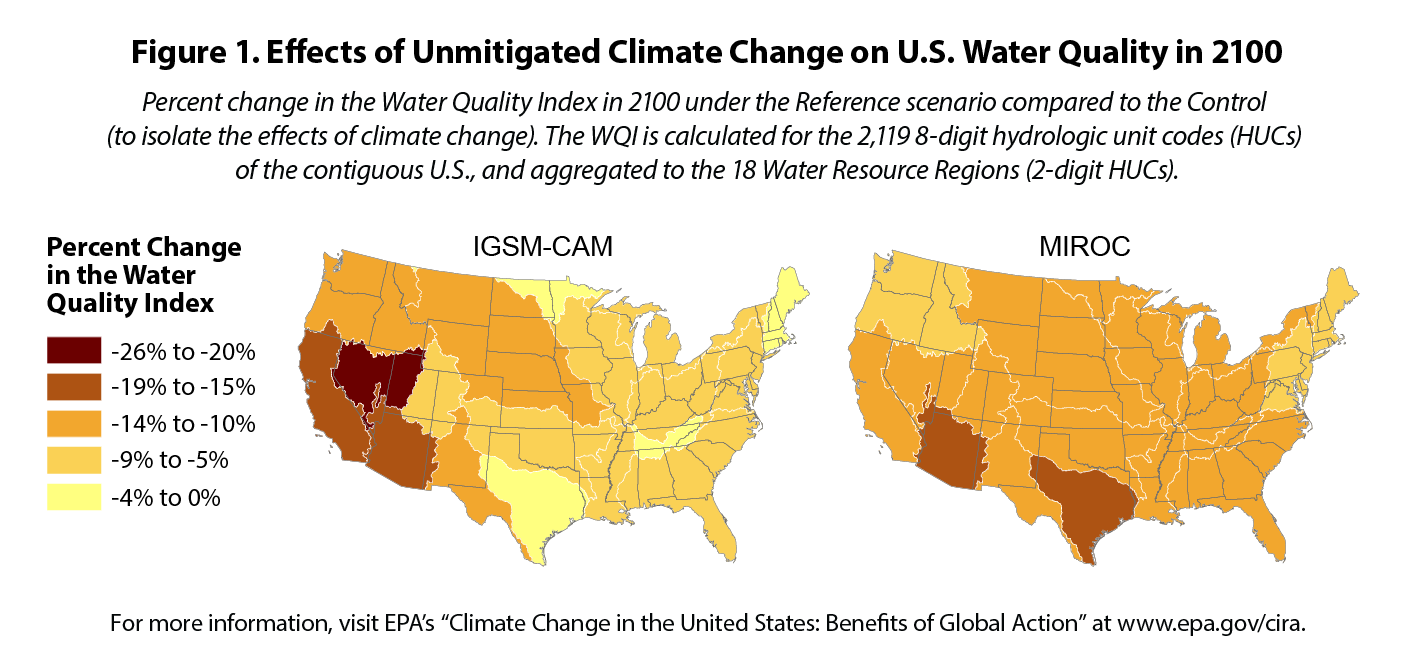
As shown in Figure 1, the WQI across the U.S. is projected to decline in the Reference scenario in 2100 using both the IGSM-CAM and MIROC climate models. Parts of Texas and the Southwest, in particular, are estimated to experience substantial WQI declines of 15-26% in 2100. Projections that climate change will decrease river and lake water quality are consistent with the findings of the assessment literature.43
Figure 1. Effects of Unmitigated Climate Change on U.S. Water Quality in 2100
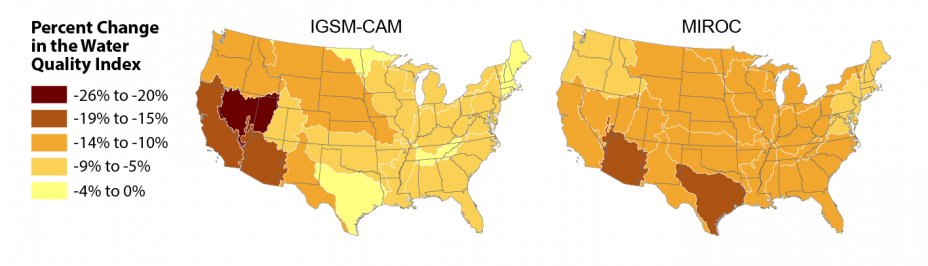 Percent change in the Water Quality Index in 2100 under the Reference scenario compared to the Control (to isolate the effects of climate change). The WQI is calculated for the 2,119 8-digit hydrologic unit codes (HUCs) of the contiguous U.S., and aggregated to the 18 Water Resource Regions (2-digit HUCs).
download the figure; download the data
Reducing Impacts through GHG Mitigation
Global GHG mitigation is projected to reduce the increase in water temperature that is estimated to occur under the Reference, with corresponding water quality benefits (i.e., avoided degradation) primarily due to better oxygenation. The effects of mitigation on total nitrogen and total phosphorus concentrations vary by region, but the increase in total nitrogen is reduced by up to 80% in some areas of the western U.S. compared to the Reference scenario.
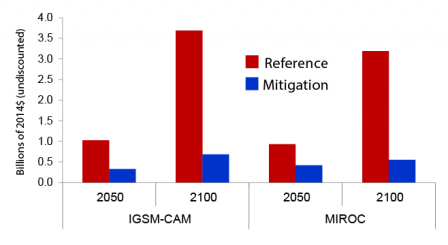
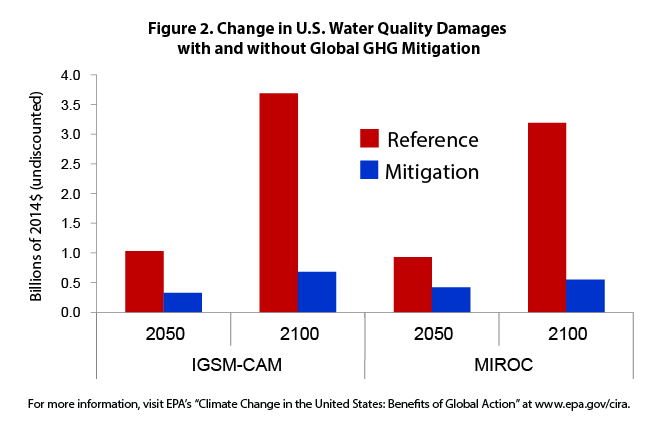
Figure 2 presents the projected change in water quality damages in 2050 and 2100 under the Reference and Mitigation scenarios for the IGSM-CAM and MIROC climate models. As shown in the figure, increases in damages are projected in both scenarios, but most notably in the Reference, where damages are estimated to increase by approximately $3.2-$3.7 billion in 2100. Under the Mitigation scenario, damages are reduced by approximately 82% compared to the Reference in 2100, corresponding to approximately $2.6-$3.0 billion in avoided costs.
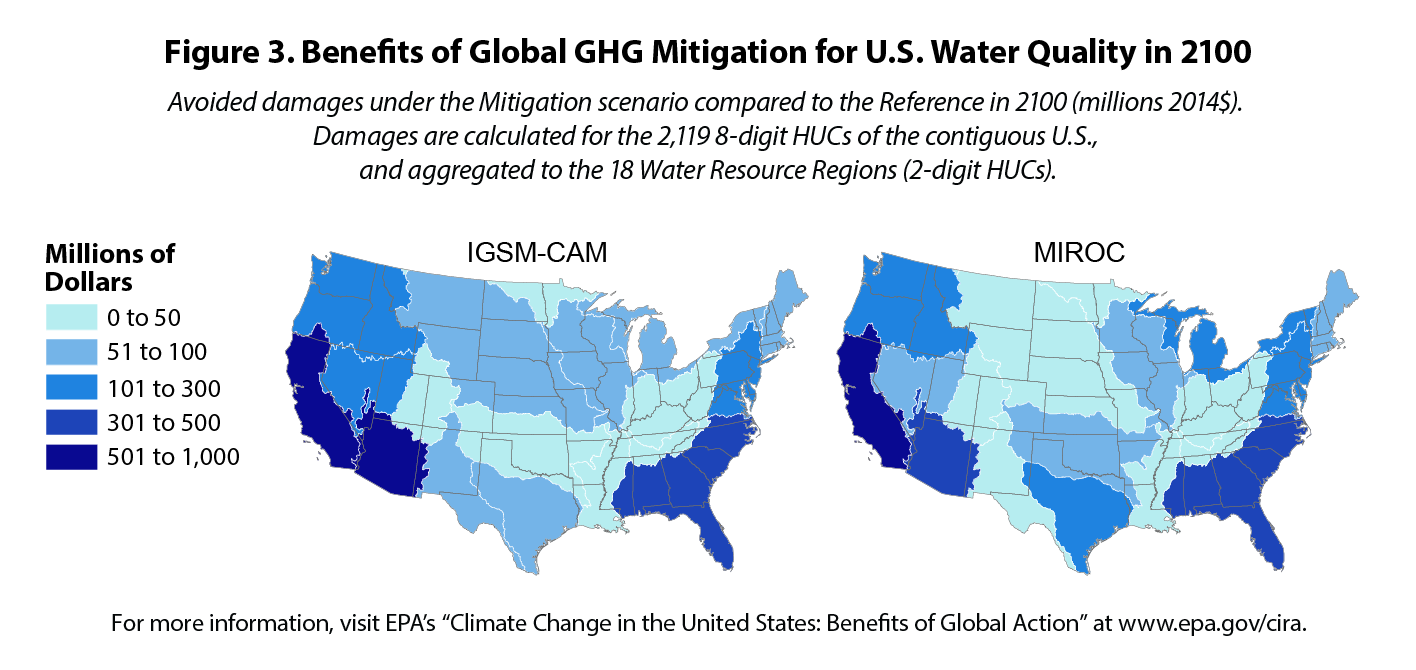
Figure 3 presents the avoided water quality damages in 2100 under the Mitigation scenario compared to the Reference using the IGSM-CAM and MIROC climate models. As shown in the figure, global GHG mitigation is projected to result in economic benefits relative to the Reference across the entire contiguous U.S. California is projected to experience the greatest benefits of mitigation in 2100, ranging from approximately $750 million to $1.0 billion.
Figure 2. Change in U.S. Water Quality Damages with and without Global GHG Mitigation
 download the figure; download the data
Figure 3. Benefits of Global GHG Mitigation for U.S. Water Quality in 2100
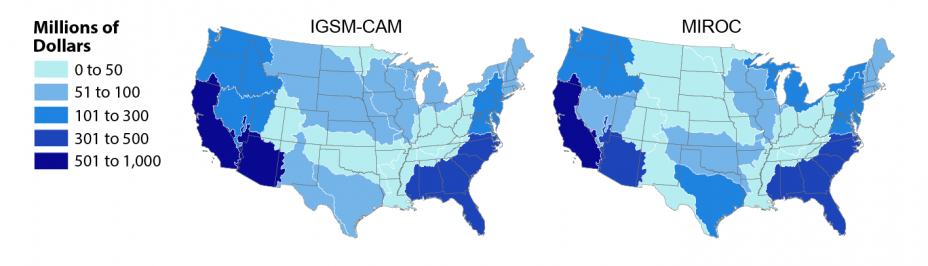 Avoided damages under the Mitigation scenario compared to the Reference in 2100 (millions 2014$). Damages are calculated for the 2,119 8-digit HUCs of the contiguous U.S., and aggregated to the 18 Water Resource Regions (2-digit HUCs).
download the figure; download the data
Approach
The CIRA analysis uses a series of linked models to evaluate the impacts of climate change on water quality in futures with and without global GHG mitigation. The analysis relies upon climate projections from two climate models: IGSM-CAM, which projects a relatively wetter future for most of the U.S., and the drier MIROC model. The CIRA temperature and precipitation projections inform a rainfall-runoff model (CLIRUN-II) that estimates river flow.44 A water demand model projects water requirements of the municipal and industrial (M&I), agriculture, and other sectors. The runoff and demand projections inform a water supply and demand model that estimates reservoir storage and release, and in turn produces a time series of water allocations for the various demands. After this allocation step, the analysis relies on the QUALIDAD water quality model to simulate a number of water quality constituents in rivers and reservoirs.45 Changes in overall water quality are estimated using changes in the Water Quality Index (WQI), a commonly used metric that combines multiple pollutant and water quality measures. Finally, a relationship between changes in the WQI and changes in the willingness to pay for improving water quality is used to estimate the economic implications of projected water quality changes.
Results for the CIRA scenarios are compared to a Control to isolate the effect of climate change. See the Water Resources section of this report for information on projected changes in the Inland Flooding, Drought, and Water Supply and Demand sectors. Decreases in water quality due to climate change will likely have an adverse effect on human health due to, for example, the increased risk of harmful aquatic blooms and impacts on sources of drinking water. Human health effects due to decreased water quality are not estimated, but are important considerations to fully understand climate change impacts in this sector. Inclusion of these effects would likely increase the benefits of GHG mitigation in this sector.
For more information on the CIRA approach and results for the water quality sector, please refer to Boehlert et al. (2015)46