Advances in Critical Load Science and the Impacts From Nitrogen Deposition and Climate Change on Forest Biodiversity and Ecosystem Services
Background
 Air pollution resulting in atmospheric deposition of nitrogen (N) and/or sulfur (S) can have a range of effects on terrestrial and aquatic ecosystems, including increased plant growth, decreased plant biodiversity, soil acidification, increased invasive species, increased damages from pests and frost, and elevated nitrogen pollution to surface waters impacting aquatic biota. Researchers have developed quantitative thresholds for N and S deposition levels above which negative effects occur, termed critical loads (CL).
The purpose of this research is to better understand the vulnerabilities of natural communities to the combined effects of atmospheric deposition and climate change, and to make key advances in the science and application of critical loads research.
Summary of the Research
Researchers have developed three research efforts to advance the understanding of impacts from N and S deposition on ecosystems, and how future climate scenarios may interact with N and S deposition to affect forested communities and the ecosystem services they provide. Specifically, these projects are:
- Assessing ecological vulnerability to N and S deposition historically and in the near-term future for the period between 1800-2025) to understand the current “state of knowledge” for the U.S.,
- Advancing the methodology for estimating critical loads of soil acidification, which remain underdeveloped in the U.S. despite their importance,
- Developing a “proof-of-concept” approach for the nation, and pilot-application in the Northeastern U.S, to quantify the effects of atmospheric deposition and climate change on forest tree composition and the ecosystem services they provide.
Project 1: Ecological vulnerability to N and S deposition from 1800-2025 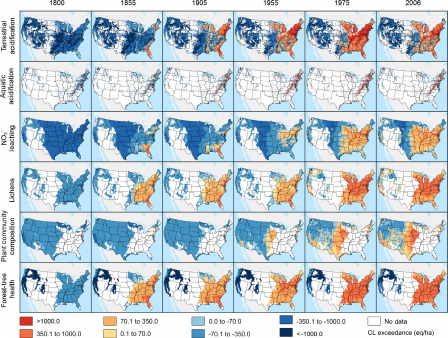 Figure 1: Geographic variation in exceedances of the six critical loads examined in this study from 1800-2006 (illustrative decadal averages are shown centered on the intervening year; e.g. “1955” represents the average from 1950-1959).
Quantifying and clarifying trends in terms of where, when, and by how much N and/or S deposition is above a critical load – referred to as an exceedance – is critical to helping decision makers better understand ecological vulnerabilities to atmospheric deposition. This project sought to better understand what critical loads were exceeded, where in the contiguous U.S. (CONUS) those exceedances occurred, and when those exceedances occurred either historically (i.e. 1800-2011) or projected into the near future (i.e. 2025)i.e. 2025).[1] To conduct this analysis, we overlaid critical load information from the National Critical Loads Database (NCLD) for six critical loads[2], with atmospheric deposition estimates from 1800-2025 from a variety of sources.[1]
There were several overarching findings from this study:
- Minimum CLs were relatively uniform across the country and had been exceeded for decades beginning in the late-19th and early-20th century in the east (Figure 1).
- The area exceeding minimum CLs peaked in the 1970s and 1980s, exposing 300,000 to 3 million kilometers (km2) (depending on the CL type) to potentially harmful levels of deposition (total of 5.8 million km2 or 70% of the coterminous U.S. in exceedance).
- By 2011, deposition levels had declined significantly, especially for S, with modest reductions in exceedance by 2011 for all CL types, (totaling 5.2 million km2 in exceedance).
- By 2025, current regulations were projected to reduce exceedances of one-or-more CL from 5.2 million km2 in 2011 to roughly 4.8 million km2 in 2025 across all scenarios examined (Figure 2).[3]
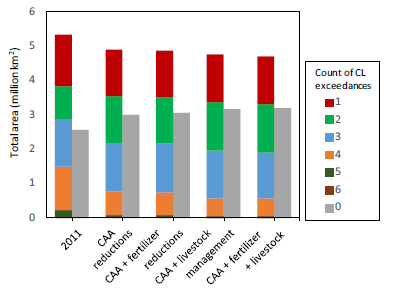 Figure 2: Total area and number of minimum CLs exceeded in 2011 and in 2025 for the four emissions control scenarios examined (see footnote 4).
In total, this effort demonstrated that many critical loads have been exceeded for decades in the U.S., and are likely to remain so in the short term under current policies. Additional improvements to the methodology were also identified including:
- Repeating the analysis using the TDEP estimates of deposition[4], which were not available at the time,
- Including the newer critical loads that were also not available at the time, and (3) including estimates of uncertainty for these critical loads and associated exceedances.
Project 2: Advancing estimates for critical loads of terrestrial acidification.
Soil acidification can come from N, S, or both, and is a major potential impact of atmospheric deposition. It can lead to a cascade of negative ecological impacts, including increased aluminum concentrations in the soil (which is harmful to plants), nutrient imbalances in plant tissue, damage to root biomass, and overall reduced forest tree health, vitality, and regeneration rates of seedlings.
The most important factor contributing to estimates of the critical loads for acidification, is the base cation weathering rate (BCw), which describes the natural replenishment of base cations to the soil that can buffer acidity. It was discovered during the 2008 Risk and Exposure Assessment for the NOx and SOx secondary standards, that the primary method for estimating BCw was only valid for glaciated soils, and thus was not valid for roughly 75% of the contiguous U.S.
EPA began to develop a method to estimate BCw across the CONUS, and apply that method to update the critical loads for soil acidification in the U.S. This built off an important pilot project in Pennsylvania, which used the dynamic soil model PROFILE.[5]
There were eight different sources of uncertainty in PROFILE evaluated under different simulation “activities”, and researchers found that four of them had a significant effect on BCw:
- Allocation of minerals to different soil texture classes (Activity 1b),
- Climate (Activity 3),
- Soil surface area (SSA, Activity 4)and
- Rooting depth (Activity 6b).
EPA found these uncertainties had a large effect on BCw (and the critical load for acidification by extension), affecting BCw by -95% to +300% in some cases. These had not been accounted for in the Pennsylvania pilot project, but will be accounted for in the follow-on work.
Key results of the uncertainty analysis and a plan for reducing those uncertainties were published in a peer reviewed publication,[6] and helped lay the foundation for ongoing work to improve estimates of critical loads of soil acidification and reducing uncertainties. Once completed (expected summer 2019), EPA researchers will have greatly improved estimates for BCw in the U.S., and thus a much-improved understanding of the degree of terrestrial acidification in the U.S.
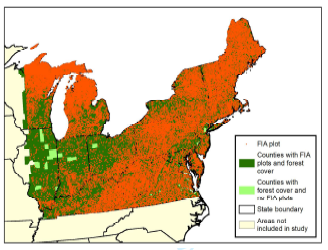 Figure 3: Northeastern study area. FIA plots are orange points, and counties with (dark green) and without (light green) FIA points are shown.
This project focused on a 19-state area in the Northeastern U.S. where EPA had information on species-level responses to N deposition (Figure 3) from a large-scale analysis conducted by Thomas et al. (2010).[7] Researchers combined these species-level responses to N deposition and climate change, with future estimates of N deposition and climate change from a variety of sources, to project how forest composition in the Northeastern U.S. may change from 2005 to 2100. Once these changes in forest composition were generated, they calculated how three ecosystem services may be affected: (1) timber, (2) carbon sequestration, and (3) forest tree diversity
Forest tree diversity is both a final ecosystem service that humans value directly, and an intermediate ecosystem service due to the many services that it underpins (e.g. water purification, habitat for game species, resistance to invasion, etc.). EPA found[8] wide variation in terms of which species increased versus decreased from climate and nitrogen deposition (Table 1). There were six species that were harmed by higher rates of N deposition (i.e. chestnut oak, American basswood, yellow birch, bigtooth aspen, quaking aspen, and paper birch) and 10 species that benefitted from higher N deposition (i.e. red maple, black cherry, sugar maple, yellow poplar, eastern white pine, northern red oak, white ash, scarlet oak, pignut hickory, and northern white cedar).
Larger changes in climate decreased biomass of six species (black cherry, yellow-poplar, northern red oak, white ash, northern white cedar, and red pine), and increased biomass of 15. Thus, there were “winners and losers” for all climate and N deposition scenarios examined, with different species at risk from different stressors.
Overall, there were more trees that benefitted than were harmed with higher levels of N deposition and changes in climate, because more abundant species tended to be less vulnerable, and less abundant species tended to be more vulnerable. This led to increases in timber and carbon sequestration overall for the Northeastern U.S. with elevated N deposition and larger changes in climate, despite a reduction in the biomass of many individual species.
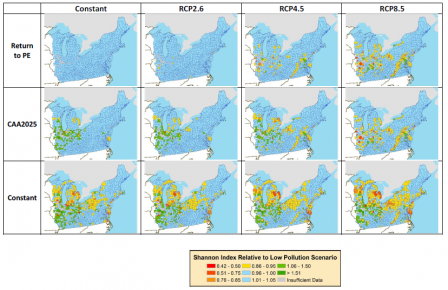 Figure 4: Tree diversity responses by county in 2100 relative to the reference (low pollution state: return to pre-European deposition and constant climate). Colors indicate a relative increase (green) or decrease (red) in tree diversity.Tree biodiversity, however, showed complex regional and stressor-specific variation (Figure 4). More climate change generally led to decreases in tree diversity, whereas more N deposition led to increased diversity in parts of the Central Midwest and decreased diversity in the Northern Midwest and East and along the Appalachian Range.
In addition to the three ecosystem services described above, EPA summarized what is known about many other ecosystem services provided by all 24-species assessed using information from the U. S. Forest Services’s (USFS) Fire Effects Information System (FEIS).Exit This summary clearly shows that there are many other services these species provide (e.g. furniture, musical instruments, habitat for protected species, medicinal value, etc.). Many of these are difficult to quantify with the same degree of rigor as the three focused on here, but qualitative assessments are possible.
Supporting Decision Making
This research supports several federal, regional, state, and local entities in managing air quality to protect natural ecosystems Specfically, this research supports decision-making under EPA’s National Ambient Air Quality Standards (NAAQS), Forest Planning conducted by the USFS, Wilderness Characterization conducted by the USFS and Fish and Wildlife Service, as well as permitting conducted by many federal, state, and local entities.
This work also contributes significantly to improving modeling tools and information that form the basis for global and national assessments of climate change, such and the National Climate Assessment led by the US Global Change Research Program.Exit This helps us better understand which tree species are vulnerable to climate change and where they are most vulnerable now and in the future.
Technical Contact: Christopher Clark, Clark.christopher@epa.gov.
[1] Clark, C. M., et al. (2018). "Atmospheric deposition and exceedances of critical loads from 1800− 2025 for the conterminous United States." Ecological Applications 28(4): 978-1002.
[2] The six critical loads we used were for terrestrial acidification, aquatic acidification, nitrate leaching, and damages to lichen communities, plant communities, or the health of forest trees. The critical loads are from NCLD v.2, described in Lynch, J., et al. (2013). Detailed Documentation of the CLAD U.S. Critical Loads of Sulfur and Nitrogen Access Database, version 2.0 (url: http://nadp.sws.uiuc.edu/claddb/dl/CLAD_DBV2_Final.pdf).
[3] The four future scenarios were: (1) expected reductions under current regulation “on the books” at the time of analysis (i.e. 2014) under Clean Air Act (“CAA reduction”), (2) CAA reduction plus implementation of best-technologically feasible management practices for fertilizer (“CAA + fertilizer”), (3) CAA reduction plus implementation of best-technologically feasible management practices for livestock operations (“CAA + livestock”), and CAA reductions plus both (“CAA + fertilizer + livestock”). Best technologically feasible reduction were from EPA (2010, Report: EPA-SAB-11-013). We also examined whether climate change affected deposition rates in 2025, but the changes were small in this near-term horizon and thus not further explored.
[4] Schwede, D. and G. Lear (2014). "A novel hybrid approach for estimating total deposition in the United States." Atmospheric Environment 92: 207-220.
[5] Phelan, J., et al. (2014). "Estimation of Soil Base Cation Weathering Rates with the PROFILE Model to Determine Critical Loads of Acidity for Forested Ecosystems in Pennsylvania, USA: Pilot Application of a Potential National Methodology." Water Air Soil Pollution 225: 2109.
[6] Whitfield, C.J., et al. (2018). “Estimating Base Cation Weathering Rates in the USA: Challenges of Uncertain Soil Mineralogy and Specific Surface Area with Applications of the PROFILE Model.” Water, Air, & Soil Pollution, 229(3), p.61.
[7] See Thomas, R. Q., et al. (2010). "Increased tree carbon storage in response to nitrogen deposition in the US." Nature Geoscience 3(1): 13-17. It is thought that species are more similar in their negative responses to S.
[8] Van Houtven et al. (in review). Nitrogen Deposition and Climate Change Effects on Tree Species Composition and Ecosystem Services for a Forest Cohort. Ecological Monographs.