Modeling the Interactive Effects from Nitrogen Deposition and Climate Change on Terrestrial Ecosystems and Biodiversity
Background on the Science
 The largest stressors to terrestrial ecosystems and biodiversity worldwide have been shown to be land use change, climate change, and atmospheric deposition of nitrogen (N) and sulfur (S). Land use change can directly destroy habitat for wild organisms, or indirectly impair remaining habitat through fragmentation and other effects. Climate change can cause an increase or decrease in plant growth, alterations in species distributions, and changes in biogeochemical cycling and runoff patterns.
Nitrogen deposition is an especially complex stressor as it can have a variety of positive and negative effects. It can cause increased plant growth, decreased plant biodiversity, soil acidification, increased invasive species, increased damages from pests and frost, and increased N leaching to water bodies.
Nitrogen deposition and climate change can also have interacting effects: N deposition can release systems from nutrient limitations that can lead to plant growth potentially enhancing their responsiveness to changes in climate.[1] Alternatively, elevated concentrations of carbon dioxide (CO2) can increase nutrient limitation, increasing the effect of a given amount of N deposition. How these two stressors interact needs to be more fully understood and can help decision makers prioritize remediation and adaptation efforts.
Summary of the Research
EPA conducted research to better understand how N deposition and climate change can interactively affect ecosystems. Broadly speaking, these efforts fall into two categories:
- Advancing fine-scale models to improve characterization of how atmospheric deposition and climate change interactively affect soil processes and plant biodiversity, and
- Advancing large-scale Earth-Systems-Models (ESMs) to improve characterization of how landscape-level processes (e.g. hydrology, carbon sequestration, and nutrient limitation) are affected by N deposition and climate change.
Merging model improvements at both of these scales will provide a flexible modeling framework to examine how these two major stressors may influence the environment now and in the future.
Advancing Fine-Scale Models
![Figure 1: Simulated trends in soil base saturation (a) and plant community composition (b, Czekanowski Similarity Index [CzI]) from 1900-2100 under the historical record (grey), and either contemporary deposition repeated in the future (D3, orange), antic](/sites/static/files/styles/medium/public/2019-04/graph_1_2.png) Many large-scale Earth system models, like those used for Intergovernmental Panel on Climate Change (IPCC) reports, do not model species. Instead, they model groups of species or habitat types (e.g. deciduous forests and grasslands). These groupings are not internally homogenous, and are made up of hundreds, if not thousands, of individual species. To assess species-level impacts from nitrogen deposition and climate change, a more refined modeling system is needed. EPA researchers reviewed several different modeling platforms and selected two as the most promising candidates for additional examination in the U.S.: the Forest-Safety-Vegetation model (ForSAFE-VEG[2]), and the augmented Very Simple Dynamic soil biogeochemistry model (VSD+) coupled with the model Predicting the Occurrence Probabilities of Plant Species (PROPS) (i.e. VSD+PROPS[3]).
Many large-scale Earth system models, like those used for Intergovernmental Panel on Climate Change (IPCC) reports, do not model species. Instead, they model groups of species or habitat types (e.g. deciduous forests and grasslands). These groupings are not internally homogenous, and are made up of hundreds, if not thousands, of individual species. To assess species-level impacts from nitrogen deposition and climate change, a more refined modeling system is needed. EPA researchers reviewed several different modeling platforms and selected two as the most promising candidates for additional examination in the U.S.: the Forest-Safety-Vegetation model (ForSAFE-VEG[2]), and the augmented Very Simple Dynamic soil biogeochemistry model (VSD+) coupled with the model Predicting the Occurrence Probabilities of Plant Species (PROPS) (i.e. VSD+PROPS[3]).
Both of modeling chains are leading approaches, and currently used in Europe to assess the impacts from atmospheric deposition and climte change on plant biodiversity, as a portion of the European commitments ![Figure 1: Simulated trends in soil base saturation (a) and plant community composition (b, Czekanowski Similarity Index [CzI]) from 1900-2100 under the historical record (grey), and either contemporary deposition repeated in the future (D3, orange), antic](/sites/static/files/styles/medium/public/2019-04/graph4_0.png) Figure 1: Simulated trends in soil base saturation (top) and plant community composition (bottom, Czekanowski Similarity Index [CzI]) from 1900-2100 under the historical record (grey), and either contemporary deposition repeated in the future (D3, orange), anticipated reductions in N deposition under current rules (D4, red), or hypothetical reductions to pre-industrial N deposition (green, D2). under the Convention on Long Range Transboundary Air Pollution (CLRTAP).
Figure 1: Simulated trends in soil base saturation (top) and plant community composition (bottom, Czekanowski Similarity Index [CzI]) from 1900-2100 under the historical record (grey), and either contemporary deposition repeated in the future (D3, orange), anticipated reductions in N deposition under current rules (D4, red), or hypothetical reductions to pre-industrial N deposition (green, D2). under the Convention on Long Range Transboundary Air Pollution (CLRTAP).
In testing the feasibility of the ForSAFE-VEG model for use in the Northeastern U.S., researchers calibrated and validated the model at two field sites with sufficient data requirements (i.e. Hubbard Brook Experimental Forest, NH, and Bear Brook Experimental Forest, ME). Once calibrated[4], the models were used to project effects of climate change and nitrogen deposition from 1900-2100 on soil chemistry, nitrate leaching, and plant biodiversity at these two sites[5] and then across the Northeast.[6]
The study on the two focal sites[5] showed that soil solution chemistry was expected to only partially recover in the future with anticipated reductions in N deposition, and that climate change had a weaker effect on soil solution chemistry as compared with N deposition. The plant community, on the other hand, was sensitive to both stressors, and was not expected to recover unless under the most optimistic scenarios. (i.e. least climate change and lowest N deposition.
This project revealed that the reversibility of impacts from historical N deposition may be slower and more challenging than anticipated, and that climate change was projected to aggravate ecosystem recovery. The project also uncovered two key limitations in the approach. First, ForSAFE-VEG is very data intensive, and thus could not be deployed over more than a few dozen sites in the U.S., which may or may not be representative of the entire country. Thus, it became apparent that it would be difficult to develop niche parameters for all plant species of concern across the U.S. without a much larger effort in partnership with other federal and state agencies. Second, the performance of the ForSAFE-VEG model in accurately simulating the observed plant community required significant model tuning, which was difficult to independently validate.
Researchers decided to examine the feasibility of the second model, VSD+PROPS, which had never been applied in the U.S. Species response curves in PROPS are based on empirical observations of species distributions. This compares to ForSAFE-VEG, which is based on expert botanists assessing the range of conditions where the species could be found. To build the U.S. species-database for VSD+PROPS, researchers relied on the database that had been developed by EPA on the relative abundances of plants in ~15,000 plots across the U.S.[7] From this database, researchers were able to build species niches for 327 species at a fraction of the effort for ForSAFE-VEG (Figure 2).
Researchers then used VSD+PROPS to simulate responses of the soil chemistry and plant community to scenarios of N deposition and climate change from 1850-2100 for three sites: Hubbard Brook Experimental Forest (also had ForSAFE-VEG), Cosby 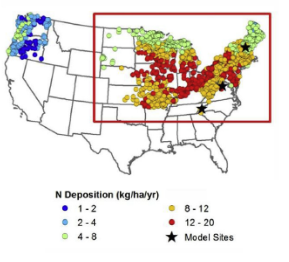 Figure 2: Point locations of the data9 for developing species response curves for the eastern U.S. (red box), along with estimates of long-term average total N deposition (2000-2013). Creek Watershed, and Piney River Watershed (the latter two in Shenandoah National Park).[8]
The success of the feasibility study for VSD+PROPS was encouraging, but not without caveats. VSD+PROPS could be run on a gridded national level much more easily than ForSAFE-VEG, however, evaluation of PROPS also revealed limitations (e.g. not enough data at the low deposition range for this region with which to estimate what may occur if deposition declined) that need improvement before the model can be used on a widespread basis. Researchers are currently modifying the modeling approach to address these limitations.
The combination of the ForSAFE-VEG and the VSD+PROPS research efforts has greatly advanced the capacity in the U.S. for simulating the interactive effects from climate change and nitrogen deposition on terrestrial ecosystems and biodiversity. Though some significant hurdles remain before deployment to support decision making, EPA researchers are working to further develop these new tools to better understand the interactive effects from N deposition and climate change to lay the foundation for other stressors to be included in the future.
Advancing Earth-System-Models (ESMs)
Earth-System-Models (ESMs) simulate coupled systems at a global scale, including biogeochemical cycling, hydrology, atmospheric dynamics, and ocean circulation patterns. These models feed into the Intergovernmental Panel on Climate Change (IPCC) Assessment Reports that inform the public, decision makers, and scientists, on the “state-of-knowledge” of regional and global climate change.
It has become increasingly appreciated that we cannot accurately simulate the effects of climate change and the global carbon cycle without the inclusion of the nitrogen cycle in these ESMs. This is because nitrogen typically limits plant productivity, which can lead to important feedbacks at the land-atmosphere interface that affect many global systems. Nonetheless, in the most recent Fifth Assessment Report by the IPCC, there was only one ESM that included an integrated nitrogen-carbon cycle – the Community Land Model version 4 (CLM.v4).[9] Although the CLM v.4 was an improvement over other models due to the inclusion of a global nitrogen cycle, it was known to be simplistic, and lacked many characteristics important to the observed nitrogen cycle. EPA researchers identified this as a critical knowledge gap in the understanding of future effects of climate change, and initiated a collaboration with the National Center for Atmospheric Research (NCAR) to support the improvement of the CLM.
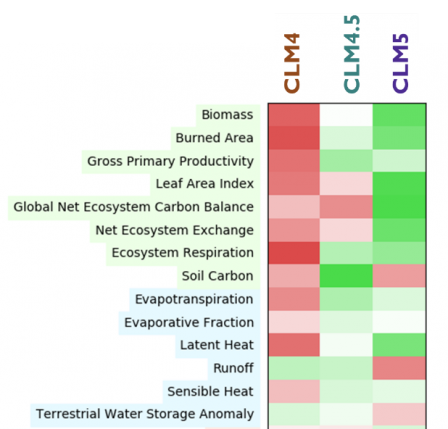 Figure 3: Improvement in the CLM from the ILAMB[11] comparison project for CLM4, CLM4.5, and CLM5 (greener is better). There were three critical areas NCAR idenfitied for improvement:
- Allow leaf nitrogen content, which co-regulates photosynthsis, to be variable with environmental conditions,
- Allow for photosynthetic capacity to vary with light availability, and
- Account or the carbon cost of different nitrogen uptake strategies.
Together, these improvements more mechanistically represent plant nitrogen dynamics in the newest version of the CLM (i.e. CLM.v5) and afford opportunities to understand, refine, and improve simulated C-N biogeochemical dynamics for the U.S. and the globe.
Simulations have been completed and demonstrated improved performance of the CLM.v5 compared with earlier versions (Figure 3). Another insight of the improved N-C coupling is that the responsiveness of the terrestrial ecosystem to elevated N is greatly diminished compared with earlier models, suggesting a reduced capacity for the land to absorb excess CO2 under elevated N deposition (Figure 4). Thus, older versions of the model projected the terrestrial system could absorb more CO2 under elevated N deposition than in actuality, suggesting a reduced capacity for natural systems to mitigate emissions.
NCAR researchers are finalizing the model output for publication in a special issue.[10] This output will form a critical component of the U.S. contribution for the next IPCC report (AR6) planned for release in 2020-2021. Another insight of the improved N-C coupling is that the responsiveness of the terrestrial ecosystem to elevated N is greatly diminished from earlier models, suggesting a reduced capacity for the land to absorb excess CO2 under elevated N deposition.
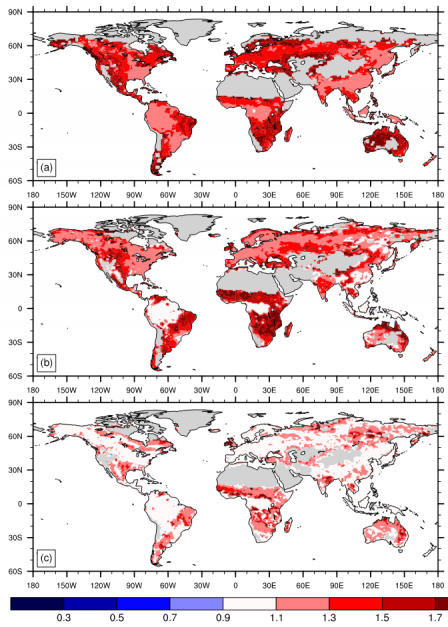 Figure 4: Gross primary production response of the CLM family of models to elevated N (+50 kg N ha-1 yr-1) for the CLM4 (a), CLM4.5 (b), and CLM5 (c). There were several next steps identified to further improve the CLM and explore model projections, including:
- Examine the U.S. portion of the global output to evaluate the domestic effects of the interaction between nitrogen and carbon cycles in greater detail,
- Integrate the CLM.v5 into a river network model to examine the implications on U.S. water quality, and
- Improve characterization of ammonia and ammonium fluxes especially into the atmosphere as a precursor to particulate matter.
With these additional improvements, the CLM will be able to simulate with increased confidence the interactive effect of climate change and nitrogen deposition on air and water quality in the U.S.
Supporting Decision Making
This research supports several federal, regional, state, and local entities in managing air quality to protect natural ecosystems. Specifically, this research supports decision-making under EPA’s National Ambient Air Quality Standards (NAAQS), Forest Planning conducted by the U.S. Forest Service (USFS), Wilderness Characterization conducted by the USFS and U.S. Fish and Wildlife Service, as well as permitting conducting by many federal, state, and local entities. This work also contributes significantly to improving modeling tools and information that form the basis for global and national assessments of climate change and the National Climate Assessment led by the US Global Change Research Program. Exit
Technical Contact: Christopher Clark, Clark.christopher@epa.gov.
[1] Greaver, T. L., et al. "Key ecological responses to nitrogen are altered by climate change." Nature Climate Change. 6.9 (2016): 836.
[2] Belyazid, S., et. al. 2011. "A dynamic modelling approach for estimating critical loads of nitrogen based on plant community changes under a changing climate." Environmental Pollution 159: 789-801.
[3] Bonten, L.T.C., et. al. 2016. “A model to calculate effects of atmospheric deposition on soil acidification, eutrophication and carbon sequestration.” Environ. Model. Software 79, 75e84. 2016.01.009.
[4] Belyazid et al. 2019. “Assessing the Effects of Climate Change and Air Pollution on Soil Properties and Plant Diversity in Northeastern U.S. Hardwood Forests: Model Setup and Evaluation.” Water Air Soil Pollution (2019) 230: 106. https://doi.org/10.1007/s11270-019-4145-6
[5] Phelan, J., et. al. 2016. “Assessing the effects of climate change and air pollution on soil properties and plant diversity in sugar maple–beech–yellow birch hardwood forests in the northeastern United States: model simulations from 1900 to 2100.” Water, Air, & Soil Pollution, 227(3), p.84.
[6] LeDuc et al. Soil chemistry and forest understory composition responses to alternative deposition and climate change scenarios in the Northeastern U.S. in prep.
[7] FY18 Product from SHC entitled “Stressor-response relationships for quantifying and predicting plant response to chronic nitrogen and sulfur deposition.” Simkin, S. M., et al. (2016). "Conditional vulnerability of plant diversity to atmospheric nitrogen deposition across the United States." Proceedings of the National Academy of Sciences 113(15): 4086-4091.
[8] McDonnell, T.C., et. al. 2018. “Feasibility of coupled empirical and dynamic modeling to assess climate change and air pollution impacts on temperate forest vegetation of the eastern United States.” Environmental Pollution, 234, pp.902-914.
[9] The CLM.v4 was developed by the National Center for Atmospheric Research (NCAR) as the land component of the Community Earth System Model (CESM).
[10] Weider et al. (in preparation). “Evaluating model assumptions with experimental manipulations.” Global Biogeochemical Cycles.