CMAQ's Support of EPA's Mission
Models are an important part of our air quality management system. They are widely used by agencies that control air pollution to both identify sources of air quality problems and to assist in the design of effective strategies to reduce harmful air pollutants in order to protect human health and the environment. Read more about the use of air quality modeling at the EPA's Support Center for Regulatory Atmospheric Modeling (SCRAM) site.
EPA program offices and state and local air agencies look to the research community to develop models that regulators can apply for planning and regulatory purposes. Air quality models are central to informing decisions and actions under the Clean Air Act (CAA) across a number of different regulatory assessments, including Regulatory Impact Assessments for federal actions, review of the National Ambient Air Quality Standards (NAAQS) for Criteria Pollutants and other health and ecosystem assessments. Some examples of these assessments are given below.
Major Regulatory Applications
Contents
Federal Actions
Inform the Legal Basis of EPA Rules
EPA has used air quality modeling to inform federal actions to address interstate transport for states under section 110 of the Clean Air Act which requires states to eliminate significant contribution to air quality problems in other states. Interstate transport rulemakings began with the promulgation of the NOx State Implementation Plan (SIP) Call in 1998 which led to a NOx Budget Trading Program to reduce regional transport of ozone by controlling NOx emissions from power plants and other large combustion sources in the eastern U.S.
In 2011 EPA promulgated the Cross State Air Pollution Rule (CSAPR) which used air quality modeling to assess transport of ozone and PM2.5 in the East. Specifically, EPA used CMAQ to project future year PM2.5 concentrations and quantify interstate contributions of PM2.5 relevant for the 1997 and 2006 PM2.5 NAAQS to provide the technical basis for developing state-level annual SO2 and NOx emissions budgets for CSAPR. EPA is currently working with states to address transport for the 2008 and 2015 ozone NAAQS.
Regulatory Impact Assessments
Executive order 12866 directed federal agencies to assess all costs and benefits of major regulations. Air quality modeling plays a key role in quantifying both costs and benefits for EPA rules.  Maps from the 2012 RIA for PM show CMAQ modeled improvement in annual average visibility levels in 2020 associated with all the Clean Air Act Amendments of 1990 (CAAA) provisions compared to a scenario without the CAAA.
Examples of Regulatory Impact Assessments that have used the CMAQ model are given below.
You may need Adobe Reader to view the files below. See EPA’s About PDF page to learn more.
- Office of Transportation and Air Quality Tier III Motor Vehicle and Fuel Standard (PDF)(617 pp, 14.6 M)
- Office of Transportation and Air Quality Renewable Fuel Standard Program (RFS2)
- Regulatory Impact Assessment for the Final Revisions to the National Ambient Air Quality Standards for Particulate Matter (2012) (PDF)(474 pp, 10.1 M)
State Actions
When EPA establishes a new National Ambient Air Quality Standard (NAAQS) or revises an existing NAAQS, it must designate areas as meeting (attainment) or not meeting (nonattainment) the standard. The Clean Air Act (CAA) requires states with designated nonattainment areas to develop a State Implementation Plan (SIP) - a plan to attain NAAQS standards.
An important component of many SIPs is an attainment demonstration. This is a demonstration, most often using air quality modeling, which shows how states will attain the NAAQS in a future year. The Air Quality Modeling Group within the Office of Air Quality Planning and Standards provides technical guidance to states on how to conduct modeling as part of these demonstrations for O3, PM2.5 and regional haze.
- Modeling Guidance for Demonstrating Air Quality Goals for Ozone, PM2.5, and Regional Haze (2018) (PDF) (205 pp, 2.2 MB, About PDF)
Many states have used CMAQ and other air quality models to support their attainment demonstrations. Models are used to determine which emissions control measures are needed to improve air quality to a level that meets the standards by CAA mandated deadlines. Below are a few examples of SIPs that have used CMAQ.
The following links exit the site Exit
- Georgia Environmental Protection Division (PDF) (144pp)
- Maryland Department of the Environment
- New Jersey Department of Environmental Protection
- New York Department of Environmental Conservation
- Utah Department of Environmental Quality
- Virginia Department of Environmental Quality
- South Coast Air Quality Management District
- San Joaquin Valley Unified Air Pollution Control District (PDF)(740pp)
Health and Environmental Assessments
Risk and Exposure Assessments for Review of National Ambient Air Quality Standards (NAAQS)
EPA establishes National Ambient Air Quality Standards (NAAQS) for six criteria air pollutants: carbon monoxide, nitrogen dioxide, sulfur dioxide, lead, ozone and particulate matter. Primary standards are set to protect public health with an adequate margin of safety. Secondary standards are set to protect public welfare including ecosystem services, visibility and other impacts.
The CAA requires that EPA review the science every five years for each pollutant to determine whether the science supports retaining or revising the existing standard levels. As part of this process, EPA may develop a Risk and Exposure Assessment (REA) which quantifies the exposures and associated risks to human health or the environment associated with the existing standard and any alternative standards under consideration. CMAQ has been used to create air quality inputs to exposure and risk analyses in recent REAs.
PM Health REA
The PM REA estimated exposures to PM and resulting premature mortality health risks within the U.S. at existing and potential alternative levels of the PM standard. CMAQ modeling data was used to produce surfaces of PM that served as inputs to risk calculations.
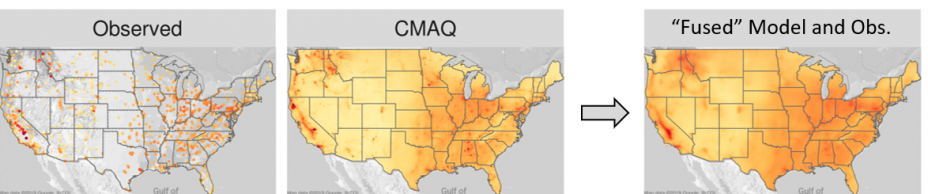 Fusion of 2015 PM2.5 concentrations from observations and CMAQ to create a “best-estimate” field for use in PM2.5 projections
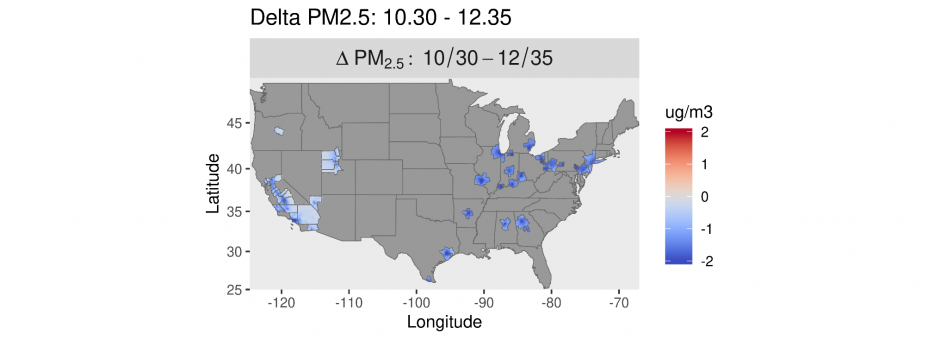 Change in annual PM2.5 concentrations associated with just meeting the two NAAQS levels in 47 urban areas
2014 Ozone Health REA
The 2014 Ozone Health REA document estimated exposures to ozone and resulting mortality and morbidity health risks within the U.S. at various potential levels of the ozone standard. Air quality modeling data was used to help produce ozone surfaces that served as inputs to exposure models and risk calculations.
A particular version of CMAQ instrumented with a tool called Higher Order Decoupled Direct Method (CMAQ-HDDM) was used in this study to look at how ozone concentrations might change in response to emissions reductions implemented to meet various potential standard levels. Using this method, the authors could examine the range of possible ozone responses (and resulting health impacts) to ozone emissions changes of various ozone precursors in different areas.
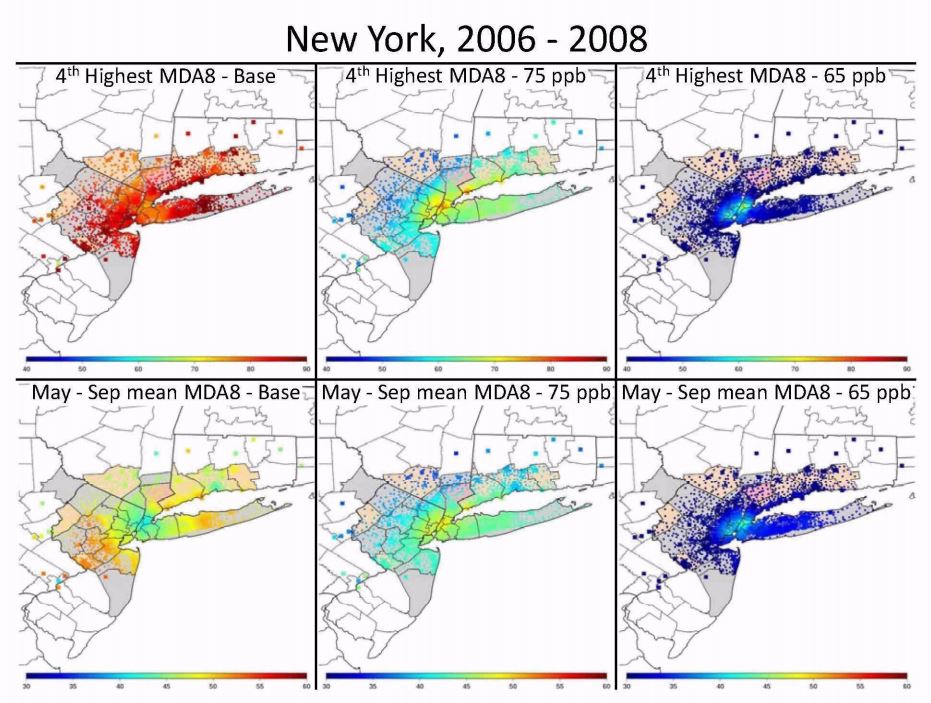 Maps showing the 4th highest (top) and May-September average (bottom) daily maximum 8-hr average O3 concentrations in New York based on 2006-2008 ambient measurements (left), HDDM adjustment to meet the existing standard (center), and HDDM adjustment to meet the alternative standard of 65ppb (right). Squares represent measured values at monitor locations; circles represent VNA estimates at census tract centroids.
2014 Ozone Welfare REA
The 2014 Ozone Welfare REA document estimated ecosystem and agricultural system impacts that could be expected under various levels of the ozone NAAQS under consideration. Again, CMAQ-HDDM was used to characterize air quality surfaces that represent what spatial patterns of ozone would look like nationwide at various levels of the standard. These air quality surfaces served as the basis for crop yield loss and tree relative biomass loss evaluations.
 National surface of 2006-2008 average W126 concentrations (in ppm-hrs) adjusted to meet the potential alternative standard of 15 ppm-hrs.
- Learn more about the W126 Index shown in this map.
- Learn more about both the 2014 Ozone Health REA and the Welfare REA.
Policy Assessments for Review of the NAAQS
Among pollutants with National Ambient Air Quality Standards (NAAQS), ozone is unique in that high concentrations can periodically occur without appreciable contributions from domestic anthropogenic precursor emissions. Any ozone formed by processes other than the chemical conversion of local or regional ozone precursor emissions is generically referred to as “background” ozone. As part of the 2014 policy assessment for the review of the ozone NAAQS, EPA used CMAQ to characterize how the contribution of background sources and processes to ozone levels over the U.S.
 Figure 2-11 from the 2014 Ozone Policy Assessment.
Map shows the 2007 CMAQ-estimated seasonal mean U.S. background ozone levels (ppb) from zero-out modeling.
The policy assessment presents a staff analysis of the scientific basis for policy options for consideration by senior EPA management prior to rulemaking. Such an evaluation of policy implications is intended to help ‘‘bridge the gap’’ between the Agency’s scientific assessments and the judgments required of the EPA Administrator in determining whether it is appropriate to retain or revise the NAAQS. Specifically, CMAQ was used to estimate how much ozone would remain within the U.S. if all domestic emissions were completely removed. As shown in the figure below, CMAQ estimates that background ozone impacts in the U.S. are greatest in the intermountain west, where seasonal mean levels of background ozone can exceed 40 ppb.
- 2014 Policy Assessment for the Review of the Ozone National Ambient Air Quality Standards (NAAQS)
- 2011 Policy Assessment for the Review of the Secondary NAAQS for Oxides of Nitrogen and Oxides of Sulfur
National Air Toxics Assessment (NATA)
The purpose of NATA is to identify and prioritize air toxics, emission source types and locations that are of greatest potential concern in terms of contributing to population risk. The most recent 2014 NATA assessment included emissions, ambient concentrations, and exposure estimates for 180 of the 187 Clean Air Act air toxics plus diesel particulate matter. EPA uses the results of these assessments in many ways, including:
- to work with communities in designing their own local-scale assessments;
- to set priorities for improving data in emissions inventories; and
- to help direct priorities for expanding and improving the network of air toxics monitoring.
The 2014 assessment utilized the multi-pollutant version of the CMAQ photochemical model and the AERMOD dispersion model to inform a hybrid approach that addressed mass conservation, atmospheric transformation (formation and decay), and long-range transport to improve the characterization of toxics concentration in predicting toxics risks across the nation. Over sixty HAPs were modeled using CMAQ for the 2014 NATA. A 2014 NATA Technical Support Document provides more information on the CMAQ use in 2014 NATA assessment.
- Modeling toxic air pollutants with CMAQ
- Download list of air pollutants in the 2014 NATA assessment: 2014_nata_supplemental_data_files_0.zip(.zip file, 39MB)
- 2014 NATA Technical support document
Chesapeake Bay Total Maximum Daily Load
On December 29, 2010, EPA established the Chesapeake Bay Total Maximum Daily Load (TMDL). Since then, pollution control measures have been implemented across six states and the District of Columbia to restore clean water in the Chesapeake Bay and the region's streams, creeks and rivers.
Atmospheric deposition is the second largest source of nitrogen (N) to the Chesapeake Bay watershed and represents an important source of N loading. CMAQ modeled N deposition is used by Chesapeake Bay Program as a nitrogen input to characterize the reduction of atmospheric N loading over time.