Evaluation of CMAQ Applications at Neighborhood Scales
Introduction
Eulerian air quality models, such as CMAQ, discretize large simulation domains into smaller sized grid cells in order to better represent spatial heterogeneities. In theory, smaller-sized grid cells provide a truer representation of fine-scale processes and near-field impacts. While utilizing larger grid cells has the advantage of minimizing computation resources, it does have several disadvantages.
Since Eulerian air quality models instantly dilute point emissions across the entire volume of the grid cell, decisions on grid resolution should be made with consideration of the spatial scale of the air quality problem, meteorology, and emissions being modeled while also recognizing the increased computation resources required as grid cell size is decreased. The smaller the dimensions of the grid cells used, the more representative the model may be of the actual point source emissions. Additionally, meteorological fields (e.g. wind and temperature) are also likely to be better represented with smaller grid cells, particularly in areas with diverse and complex geography (e.g. coastal and mountainous regions).
Examples of Fine-Scale CMAQ Applications:
- 2011 Baltimore-Washington D.C. DISCOVER-AQ Campaign
- 2013 San Joaquin Valley (SJV) California DISCOVER-AQ Campaign
- 2014 Colorado Front Range DISCOVER-AQ/FRAPPE Campaign
- Uinta Basin Fine-Scale Modeling for Wintertime Ozone
2011 Baltimore-Washington D.C. DISCOVER-AQ Campaign
The goals of this work are two-fold. First, to demonstrate the application and skill of the coupled WRF-CMAQ modeling system at fine-scales (i.e. 4-km and 1-km). Second, to evaluate the model results of the various simulations against a high-quality meteorological and air quality observation dataset. To meet these goals, model simulations were performed at various horizontal grid resolutions ranging from relatively coarse-scale continental United States 12-km horizontal grid resolution simulations to fine-scale 1-km horizontal grid resolution simulations. Fine-scale simulations were performed for the Baltimore/Washington D.C. DISCOVER-AQ campaign for July 2011 as the campaign offered additional measurements beyond the routinely available measurements with which to evaluate the model performance at fine grid spacing. Figure 1 shows the 4-km and 1-km domains used to simulate the Baltimore/Washington D.C. DISCOVER-AQ campaign (Appel et al., 2014).
 Figure 1. Depiction of the 4-km and 1-km WRF-CMAQ domains (terrain height shown in meters). The 12-km domain (not shown) covers the entire continental U.S., including southern Canada and northern Mexico.Several new data-processing techniques have resulted from this work, as well as new sources of high-resolution input data. For example, a new technique for processing data for the WRF model was developed that greatly improves the simulated meteorological data used in the fine-scale CMAQ simulations. A technique to account for the so called “heat-island effect” often associated with large cities was also implemented in the WRF-CMAQ simulations as part of this work. Accounting for the heat-island effect helps improve the model simulated temperature and boundary layer over large cities. Finally, a high-resolution sea-surface temperature dataset was obtained to improve WRF’s temperature representation of the water bodies, such as the Chesapeake Bay. Accurate representation of the sea-surface temperatures is important for correctly simulating the land-water interactions, such as sea-breeze fronts and the marine boundary layer. Figure 2 shows the difference in the wind fields and ozone mixing ratios between a 12-km, 4-km and 1-km simulation for 5 p.m. on July 2, 2011.
Related Links
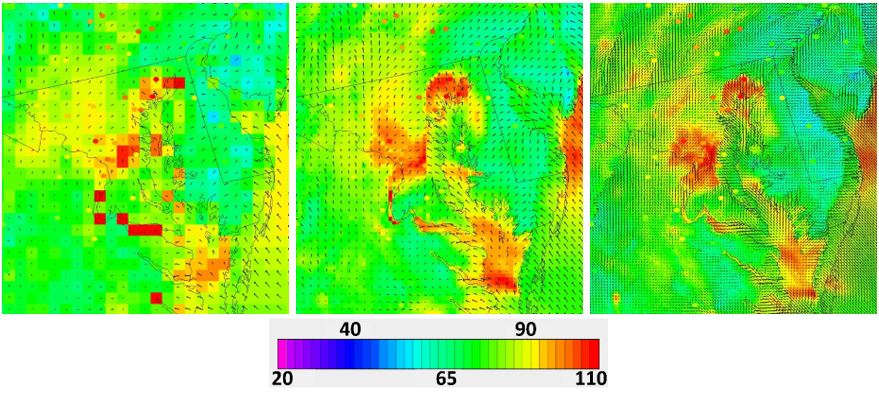 Figure 2. Ozone mixing ratio (shading; 20-110 ppb) and 10-m wind vectors for 2 July 2011 at 5PM local time using 12-km (left), 4-km (center) and 1-km (right) horizontal grid spacing. The 12-km and 4-km results have been windowed to the 1-km domain.
2013 San Joaquin Valley (SJV) California DISCOVER-AQ Campaign
 Figure 3. Depiction of the 4-km and 2-km WRF-CMAQ domains (terrain height shown in meters) used to simulate the DISCOVER-AQ campaign that took place in California in 2013.
The 2011 DISCOVER-AQ campaign took place during the summer along the east coast of the United States, where the primary pollutant of interest to measure was ozone. The 2013 DISCOVER-AQ campaign took place in and around the San Joaquin Valley (SJV) of California during January and February, where the primary pollutant of interest was PM2.5. The SJV of California offers much different modeling challenges than those found in Baltimore and Washington D.C. While the primary challenges in and around Baltimore were the large cities and influence of the Chesapeake Bay, in the SJV valley the primary challenges are the complex topography of the region, with the Pacific Ocean to the west and large mountain ranges to the east. As such, the two DISCOVER-AQ campaigns offer the opportunity to evaluate the model performance under very different conditions, helping build confidence in the ability of the modeling system to simulate pollutants under various conditions. Figure 3 shows the 4-km and 2-km domains used to simulate the California DISCOVER-AQ campaign.
2014 Colorado Front Range DISCOVER-AQ/FRAPPE Campaign
 Figure 4. Example 2-meter temperature (shading; 285-320 K) and 10-m wind vectors from the 4-km simulation of the Colorado DISCOVER-AQ campaign in July/August 2014.The 2014 DISCOVER-AQ campaign took place along the Colorado Front Range, covering Denver and several other surrounding cities. It was a joint campaign with the Front Range Pollution and Photochemistry Experiment (FRAPPE). Similar to the other DISCOVER-AQ campaigns, the 2014 DISCOVER-AQ campaign was simulated using the fine-scale WRF-CMAQ modeling system in order to better understand the interactions of the complex topography around Denver in an area of high emissions.
In addition, a number of fires from surrounding states impacted the region during the campaign period. The complex topography, large cites and numerous emission sources in the Colorado Front Range make simulating the region with finer grid resolution than the typical 12-km grid spacing advantageous. This work simulates the region using 4-km horizontal grid spacing, as seen in Figure 4. Figure 5 is an example of near surface ozone and 10-m wind streamlines.
Related Links
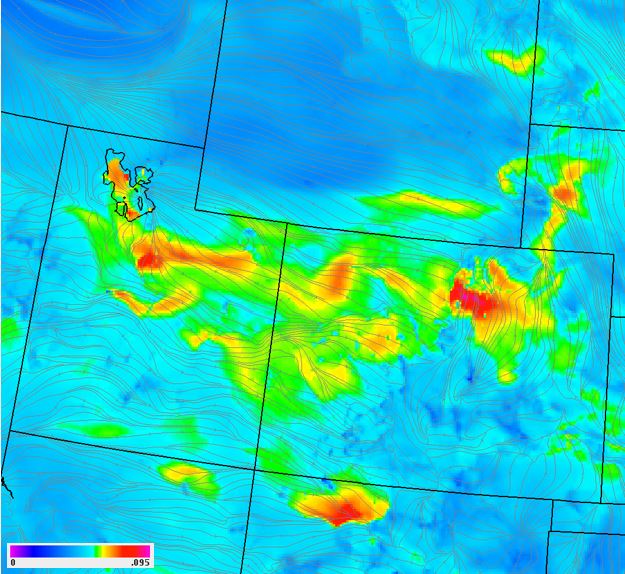 Figure 5. Example surface ozone mixing ratio (shading; 0 -95 ppbv) and 10-m wind streamlines from the 4-km simulation of the Colorado DISCOVER-AQ campaign in July/August 2014.
Uinta Basin Fine-Scale Modeling for Wintertime Ozone
The Uinta Basin in Utah spans 12,000 square miles and is home to 11,000 oil and gas wells. EPA scientists are using CMAQ to investigate high levels of ozone reported in winter in the Uinta Basin. Model simulations are being used to analyze how ozone is formed and removed in the Uinta Basin. Results of this work will assist in improving model performance in an area with complex terrain and weather conditions and understanding ways to reduce potentially harmful ozone levels created from oil and gas development in this area.
Ground level ozone is formed by a reaction of hydrocarbons and carbon monoxides in the presence of nitrogen oxides and sunlight. Typically, ozone peaks during the summer when sunlight and air conditions are more likely to be stagnant. However, in the Uinta Basin, ozone levels are at their highest during winter when sunlight reflects off snow to enhance the photo-chemical reactions.
 Figure 6. Example 2-meter temperature (shading; 260-285 K) and 10-m wind vectors from the 4-km simulation for the Uinta Basin region. The black circle indicates the location of the Uinta Basin.
Because of the mountains, valleys and complex terrain in the Uinta Basin, oil and gas sources can potentially emit high into the atmosphere and move outside of the Basin or become trapped near the surface. For this study, the researchers used data collected during winter 2013, which had high levels of ozone due to complete snow cover and stagnant weather conditions. The CMAQ system was used to explore the vertical distribution of oil and gas emissions and subsequent pollution created from these sources. As such, fine-scale 4-km CMAQ simulations of the Uinta Basin region were performed in order to help capture the interaction of pollutants with the complex terrain. Figure 6 shows example winds and 2-m temperature for the Uinta Basin.
Related Links
References
Appel, K.W., Gilliam, R.C., Pleim, J.E., Pouliot, G., Wong, D.C., Roselle, S.J., & Mathur, R. (2014). Improvements to the WRF-CMAQ modeling system for fine-scale air quality applications to the DISCOVER-AQ Baltimore/Washington D.C. campaign. EM: Air and Waste Management Associations Magazine for Environmental Managers. Air & Waste Management Association, September 2014 Issue, 16-21.
Appel, K.W., Gilliam, R.C., Pleim, J.E., Pouliot, G., Kang, D., Hogrefe, C., Roselle, S.J., Mathur, R., & Wong, C.(2014). Evaluation of regional and fine-scale applications of the two-way coupled WRF-CMAQ modeling system for the 2011 Baltimore-Washington D.C. DISCOVER-AQ campaign. 13th Annual CMAS Conference, Chapel Hill, NC, October 27-30, 2014. Presentation available from the CMAS conference website Exit.