Climate Comparison: Washington DC versus San Juan Puerto Rico
Climate Comparison for Green Infastructure Potential: Washingtong, DC versus San Juan, Puerto Rico
The figures below show some of the climate differences between the Mid-Atlantic Region (Washington Reagan National Airport) and Puerto Rico (San Juan Airport).
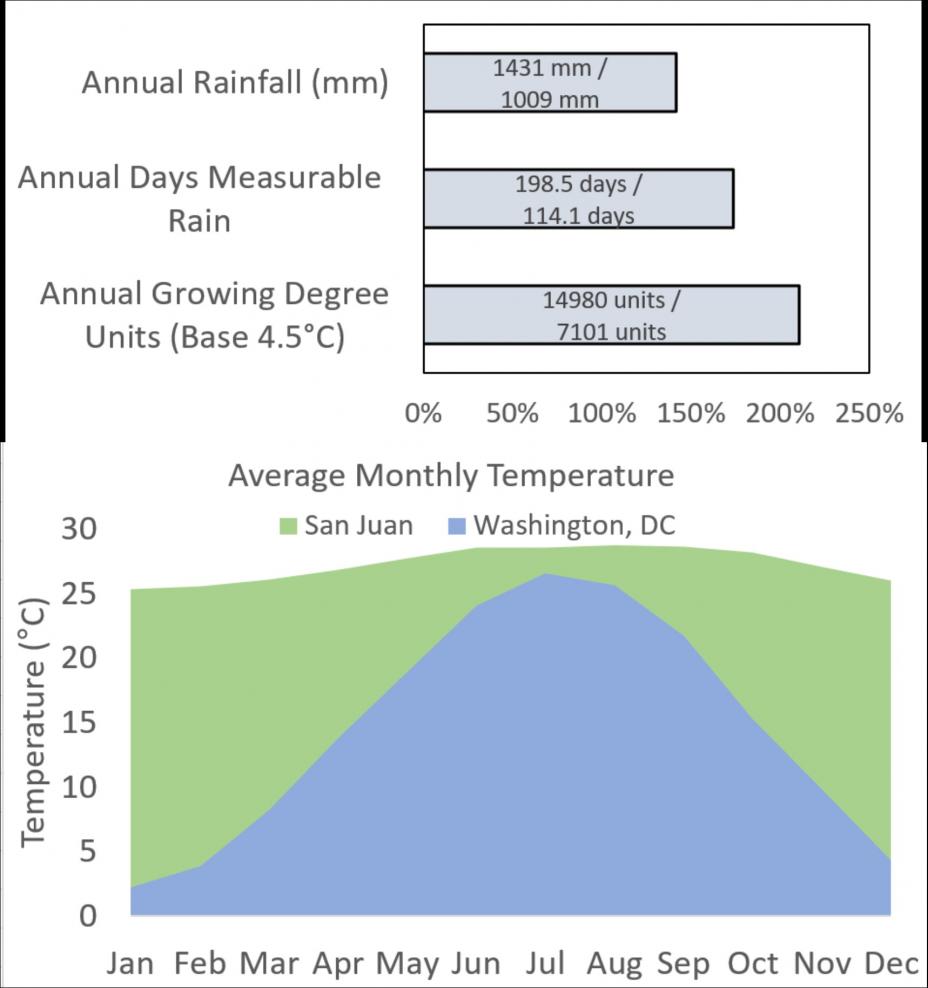
Comparatively, as shown in the bar graph, San Juan has more annual rainfall (1431 mm vs. 1009 mm in Washington, DC), more days of measurable rainfall (198.5 days vs. 114.1 days in Washington, DC), and larger, more frequent rainfall events, which means that there is less time for GI to recover between rainfall events. However, monthly average temperatures in San Juan do not vary much and never approach freezing, while mean monthly temperatures in the Mid-Atlantic drop below 4.5°C. These factors lead to the large difference (>200%) in annual growing degree units (accumulated heat above base temperature related to the rate at which plants develop) between the two regions.
The shorter growing season and dormancy of vegetation in green infrastructure (GI) limits annual evapotransportation in the Mid-Atlantic, while GI in the tropics potentially can exploit a year-round growing season to manage stormwater.
 The bar chart (top) shows a comparison of annual rainfall, measureable rainfall, growing degree units for San Juan, Puerto Rico (top number in the bar) and Washington, DC (bottom number). Monthy temperature comparison of each location is shown on the bottonw graphic (source: NOAA 2019 Climate Normals).
