EPA EcoBox Tools by Exposure Pathways - Food Chains
Overview
 When an animal consumes another organism that has been exposed to a chemical stressor there is a possibility of contaminant transfer
![]() transferProcess by which chemicals are taken up by a plant or animal either directly from exposure to a contaminated medium (soil, sediment, water) or by eating food containing the chemical.. Therefore, for any receptor type of interest, it is important to understand the concepts of food chain, trophic level, and food web.
transferProcess by which chemicals are taken up by a plant or animal either directly from exposure to a contaminated medium (soil, sediment, water) or by eating food containing the chemical.. Therefore, for any receptor type of interest, it is important to understand the concepts of food chain, trophic level, and food web.
A food chain is a series of organisms that sequentially feed on one another. Food chains show the relationships between producers, consumers, and decomposers—what eats what.
Trophic level is a functional classification of taxa within a community that is based on feeding relationships (e.g., aquatic and terrestrial green plants make up the first trophic level and herbivores make up the second) (U.S. EPA, 1998). The trophic level of a receptor is the position it occupies in a food chain.
Indicator species are receptor species selected to represent the various trophic levels evaluated in a risk assessment. Indicator species are thought to be representative of the status and reproductive success of other species in a particular habitat.
A food web is made up of interconnected food chains. Food webs were developed to assess the feeding strategies and trophic level interactions that characterize representative habitats. Animals may eat many different types of plants or many different animals. Most communities include various populations of producer organisms that are eaten by any number of consumer populations (U.S. EPA, 1994; U.S. EPA, 1999, Sections 11–13).
Food webs are designed to illustrate the particular taxa and functional groups (or feeding strategies) that each habitat comprises. Based on the trophic levels, taxa, and functional groups in the food webs, receptor species![]() receptor speciesThe ecological entity exposed to the stressor. can be identified to produce a receptor group for each representative habitat. The receptor groups reflect their respective habitat's food web and, thus, provide an effective suite of receptors for assessing exposure (U.S. EPA, 1999, Sections 11–13).
receptor speciesThe ecological entity exposed to the stressor. can be identified to produce a receptor group for each representative habitat. The receptor groups reflect their respective habitat's food web and, thus, provide an effective suite of receptors for assessing exposure (U.S. EPA, 1999, Sections 11–13).
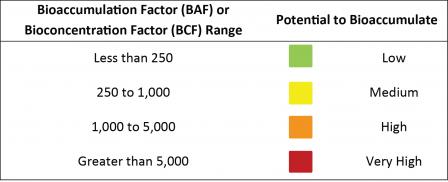
In natural environments, the ratio of the chemical concentration in an animal to the chemical concentration in its environment generally is referred to as a bioaccumulation factor, or BAF. A BAF relates the concentration of a contaminant in fish tissue to the concentration in the natural water body where the fish is found. A bioconcentration factor (BCF) can be measured, but must be evaluated under controlled situations to avoid indirect uptake through the food chain since it is the ratio of chemical concentration in the animal to chemical concentration in the water only. The general relationship between BAF or BCF and potential to bioaccumulate is shown below.
Sources: U.S. EPA 2000; 2010
Terrestrial Food Webs
The terrestrial food web includes primary producers (vascular plants) and three faunal trophic levels![]() trophic levelsEach step along a food chain; an organism's feeding level. that represent secondary and tertiary consumers (U.S. EPA, 1999, Section 13).
trophic levelsEach step along a food chain; an organism's feeding level. that represent secondary and tertiary consumers (U.S. EPA, 1999, Section 13).
- Trophic level 1 (T1) consists of species that consume only plants (i.e., the herbivores) that are potential prey for higher trophic level species. The dynamics within soil communities are very complex and include herbivores, omnivores, and carnivores at several trophic levels.
- Trophic level 2 (T2) includes species that consume plants and/or animals (herbivores, omnivores, and carnivores) and that are also prey to other carnivores or omnivores. These species can be from any faunal class (mammals, birds, reptiles, or amphibians), functional group (herbivore, carnivore, omnivore, or insectivore), or size range.
- Trophic level 3 (T3) consists of apex species, or those that do not have any predators (other than humans) in the given habitat (e.g., large mammals such as bears; raptors such as hawks).
| Trophic Level | Functional Group | Examples |
|---|---|---|
| T1 | Herbivores |
|
| T2 |
Carnivores (including insectivores) Omnivores |
|
| T3 |
Carnivores (not including insectivores) Omnivores |
|
It is important to note that many terrestrial receptors, such as ospreys or muskrats, derive all or most of their food from consumption of aquatic organisims. Additional receptors with habitat requirements that include both an aquatic component and a terrestrial component, such as bullfrogs or snapping turtles, spend significant time in the water.
Bioconcentration Factors![]() Bioconcentration FactorsRatio of the concentration of a chemical in an organism to the concentration of the chemical in its surrounding aqueous environment. BCF values are surrogate measures of the bioaccumulation potential of a chemical in organisms in the environment. (BCFs) are sometimes used to estimate contaminant concentrations in plants or animals. BCFs are derived from information on the concentrations in the food and the amount of chemical that is taken up by the plant or animal or is present in the surrounding environmental media.
Bioconcentration FactorsRatio of the concentration of a chemical in an organism to the concentration of the chemical in its surrounding aqueous environment. BCF values are surrogate measures of the bioaccumulation potential of a chemical in organisms in the environment. (BCFs) are sometimes used to estimate contaminant concentrations in plants or animals. BCFs are derived from information on the concentrations in the food and the amount of chemical that is taken up by the plant or animal or is present in the surrounding environmental media.
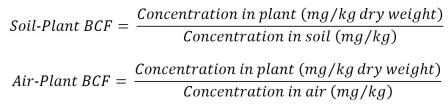
BCFs represent the relationship between the concentration of contaminant in the vegetation and the corresponding soil, water, and air concentration. For example, a soil-plant BCF measures a chemical’s ability to accumulate in plant tissue and is the ratio of contaminant concentration in plants to the concentration in soil. Similarly, an air-plant BCF (which could be mass-based or volume-based) is defined as the ratio of contaminant concentration in aboveground plant parts to the contaminant concentration in air (see below).
Aquatic Food Webs
The aquatic food web includes the following trophic levels:
- Trophic level 1 (T1), primary producers, include aquatic plants, algae, and cyanobacteria. Primary producers are autotrophs that primarily use photosynthesis to produce biomass from inorganic compounds.
- Trophic level 2 (T2) consists of herbivorous fish, benthic invertebrates.
- Trophic level 3 (T3) includes fish species that primarily consume benthic invertebrates, phytoplankton, and zooplankton.
- Trophic level 4 (T4) includes fish species that primarily consume other fish.
Some species could be assigned to either T3 or T4 (e.g., bass) depending on their life stage and habitat. Because fish occupy a range of trophic levels![]() trophic levelsEach step along a food chain; an organism's feeding level., they serve as useful indicators of community-level effects.
trophic levelsEach step along a food chain; an organism's feeding level., they serve as useful indicators of community-level effects.
| Trophic Level | Functional Group | Examples |
|---|---|---|
| T1 | Primary Producers |
|
| T2 | Herbivores |
|
| T3 |
Benthivores |
|
| T4 |
Piscivores |
|
A biota-sediment accumulation factor, or BSAF, is analogous to a BAF![]() BAFA bioaccumulation factor (BAF) is the ratio between the concentration of a chemical measured in an organism and the concentration of the same chemical in water.; it is an empirical partitioning ratio relating concentration in sediment to the concentration in an aquatic organism, including benthic organisms and higher trophic level fish. U.S. EPA Biota-Sediment Accumulation Factor Data (Available at: BSAF (Biota-Sediment Accumulation Factor) page) is a resource that contains approximately 20,000 biota-sediment accumulation factors (BSAFs) from 20 locations, mostly Superfund sites, for nonionic organic chemicals and pesticides; fresh, tidal, and marine ecosystems are included in the data.
BAFA bioaccumulation factor (BAF) is the ratio between the concentration of a chemical measured in an organism and the concentration of the same chemical in water.; it is an empirical partitioning ratio relating concentration in sediment to the concentration in an aquatic organism, including benthic organisms and higher trophic level fish. U.S. EPA Biota-Sediment Accumulation Factor Data (Available at: BSAF (Biota-Sediment Accumulation Factor) page) is a resource that contains approximately 20,000 biota-sediment accumulation factors (BSAFs) from 20 locations, mostly Superfund sites, for nonionic organic chemicals and pesticides; fresh, tidal, and marine ecosystems are included in the data.
Tools related to Food Chains and Food Webs
Resources are provided below to assess exposure to ecological receptors that occurs via food webs. See the Stressors Tool Set of EPA-Eco-Box for tools related to fate and transport of contaminants.