RadNet Graph Help
![]()

Reading the Graph
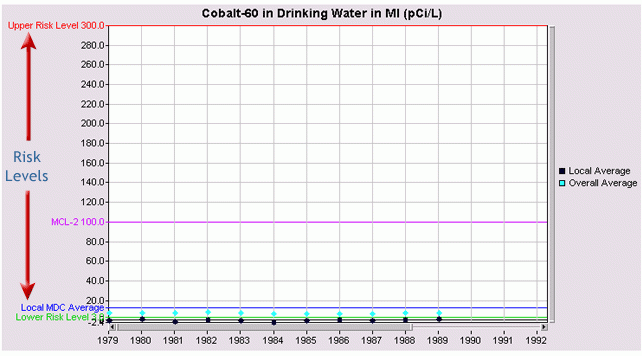
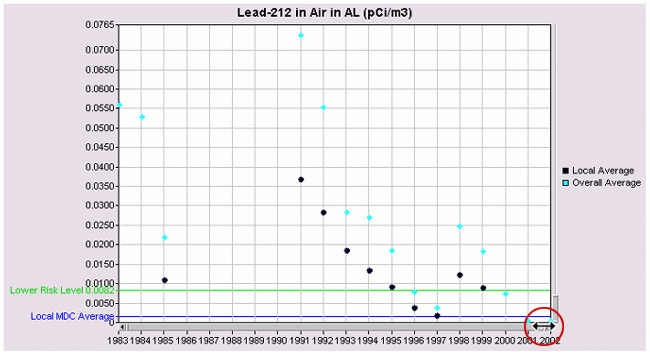
Target risk concentrations are denoted by the Upper Risk Bar in red, the Lower Risk Bar in green. Regulatory concentrations are denoted by the MCL bar in purple. The average minimum detectable concentration is an indication of the ability of the instrumentation to detect the analyte and is denoted by the MDC bar in blue.
Navigating the Graph
To read the results, you can scroll the graph from top to bottom by clicking and dragging on the scroll bar on the right side of the graph. To navigate from left to right, click and drag the scroll bar at the bottom or click the left and right arrow buttons at the bottom of the graph.
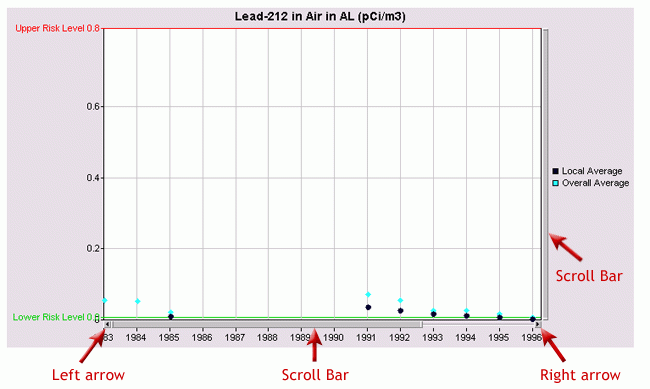 To change the height and width of the X and Y-axis, you can click on the far end of either scroll bar until the cursor becomes a two-sided arrow.
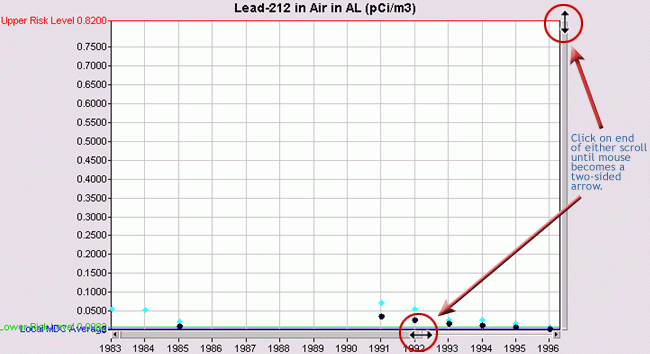 By pulling down on the two-sided arrow in the scroll bar on the right side of the page, the Y-axis is adjusted accordingly.
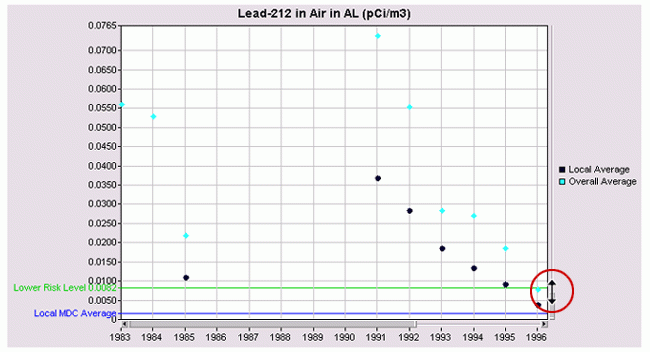
By pulling the two-sided arrow in the scroll bar at the bottom of the page from left to right, the X-axis is adjusted accordingly.
Selecting an Average
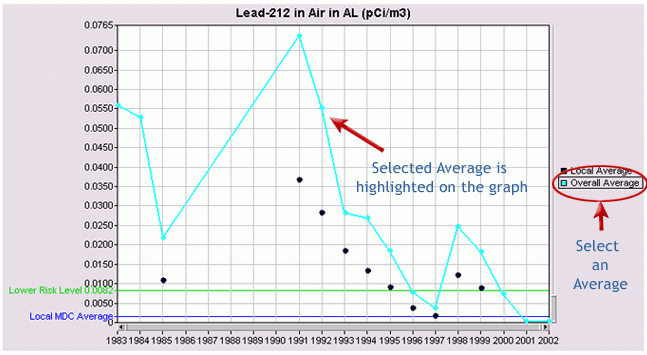
To highlight the Local Average or Overall Average, click on either item on the right side of the graph. The designated average will be highlighted on the graph.
Additional Resources
Additional information for reading the results, as well as benchmark and fact sheets can be assessed throught the hyperlinks at the bottom of the page beneath the graph.


