ExpoKids: Data Visualization Tool for Aggregate Exposure by Lifestage and Media
[NOTICE] ExpoKids: An R-Based Tool for Characterizing Aggregate Environmental Exposure During Childhood article published in JESEE on October 5, 2020 by Dai, Euling, Phillips, and Rice. Available at: https://www.nature.com/articles/s41370-020-00265-6 Exit
In 2019, an extension to ExpoFIRST named ExpoKids, was developed by EPA's Office of Research and Development (ORD) and Office of Children’s Health Protection (OCHP) scientists to allows for visualization of aggregate exposure estimates, produced by ExpoFIRST, across lifestages. ExpoKids was released on the EPA website in October 2020.
ExpoKids Version 1.0 is an R-based visualization tool that graphically illustrates estimates of relative exposure and aggregate exposure sources within and across lifestages. This tool works with EPA’s Exposure Factors Interactive Resource for Scenarios Tool (ExpoFIRST) to estimate average daily dose (ADD) and lifestime average daily dose (LADD) by lifestage. ExpoFIRST is a standalone tool that utilizes the EPA's Exposure Factors Handbook (EFH) to provide deterministic potential dose estimates for user-defined exposure scenarios.
The EFH summarizes available human exposure data and is the standard EPA reference for recommended exposure factors. Because ExpoFIRST is used to estimate ADDs by lifestage, ExpoKids v1.0 is limited to visualizing ADDs from the oral exposure route for postnatal childhood lifestages (from birth to puberty) and includes adults as a comparator group. Chemical-specific exposure information for various media are input into ExpoFIRST to calculate ADDs by lifestage. These ADDs from ExpoFIRST can then be input into ExpoKids to display aggregate oral exposure estimate ADDs and lifetime average daily doses (LADDs) in graphs organized by 7 postnatal and adult lifestages for 10 media.
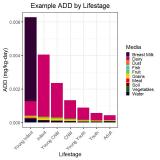
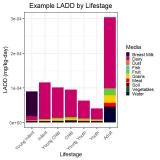
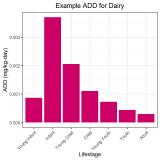
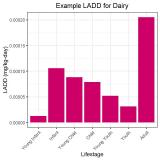
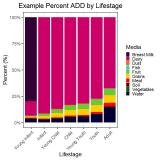
To illustrate the five different ExpoKids graph types, sample data (see link to sample data table, below) were used to produce graphs in ExpoKids. To enlarge the image size, please click on the images (below). Five different ExpoKids graphs using sample data:
ExpoKids R Tool Datasets
- ExpoKids Data Table Template (MS Excel)(11 K, 08/09/2019)
- ExpoKids Sample Data Table (MS Excel)(12 K, 08/09/2019)
To obtain the ExpoKids user guide and R code, please see the ExpoKids Supplementary Information Files 1 and 2 from the Dai et al., 2020 JESEE article.

