Exposure Assessment Tools by Tiers and Types - Deterministic and Probabilistic Assessments
Overview

Initial exposure assessments, including screening-level assessments, usually begin by using a deterministic approach. This approach uses point values and simple models to produce a point estimate of exposure (either high-end or typical exposure). Deterministic assessments are simple to carry out, often use readily available data, and produce results that are straightforward to interpret.
Probabilistic assessments use more complicated modeling approaches that rely on distributions of data as inputs in place of point values for key parameters. This results in a distribution of possible exposure estimates and greater ability to characterize variability and uncertainty.
Description
A deterministic![]() deterministicA methodology relying on point (i.e., exact) values as inputs to estimate risk; this obviates quantitative estimates of uncertainty and variability. Results are also presented as point values. Uncertainty and variability may be discussed qualitatively, or semi-quantitatively by multiple deterministic risk estimates. [EPA 2004] assessment uses single values, or point estimates, as inputs to the exposure equation. As a result, the output of a deterministic assessment is a point value for exposure. Deterministic approaches can be used for both screening-level and higher-tier assessments and as components in the assessment of multiple stressors and multiple pathways.
deterministicA methodology relying on point (i.e., exact) values as inputs to estimate risk; this obviates quantitative estimates of uncertainty and variability. Results are also presented as point values. Uncertainty and variability may be discussed qualitatively, or semi-quantitatively by multiple deterministic risk estimates. [EPA 2004] assessment uses single values, or point estimates, as inputs to the exposure equation. As a result, the output of a deterministic assessment is a point value for exposure. Deterministic approaches can be used for both screening-level and higher-tier assessments and as components in the assessment of multiple stressors and multiple pathways.
A probabilistic![]() probabilisticA type of statistical modeling approach used to assess the expected frequency and magnitude of a parameter by running repetitive simulations using statistically selected inputs for the determinants of that parameter (e.g., rainfall, pollutants, flows, temperature). [EPA 2004] assessment uses distributions of data from which multiple points are selected as inputs to the exposure equation over the course of multiple simulations. As a result, the output of a probabilistic assessment is a distribution of potential exposure values. Probabilistic approaches are generally used only for higher-tier assessments.
probabilisticA type of statistical modeling approach used to assess the expected frequency and magnitude of a parameter by running repetitive simulations using statistically selected inputs for the determinants of that parameter (e.g., rainfall, pollutants, flows, temperature). [EPA 2004] assessment uses distributions of data from which multiple points are selected as inputs to the exposure equation over the course of multiple simulations. As a result, the output of a probabilistic assessment is a distribution of potential exposure values. Probabilistic approaches are generally used only for higher-tier assessments.
Below are characteristics typical of deterministic and probabilistic assessments. These are not necessarily components of all deterministic or probabilistic assessments.
| Deterministic | Probabilistic | |
|---|---|---|
| Inputs |
|
|
| Deterministic assessments use single values or point estimates as inputs to the exposure equation. Health-protective assessments typically use a deterministic approach with default high-end point estimates. Deterministic assessments might also use central tendency Assessments that use a probabilistic approach use distributions of data for some of the input variables. Probability distributions Probabilistic approaches typically require more resources and expertise than using a deterministic approach given that the assessor must select and fit distributions for input parameters. Probability distributions need not be included for all input variables. Typically a sensitivity analysis is conducted to determine which exposure pathways and parameters contribute significantly to the overall variability and uncertainty in the exposure estimates. Probability distributions are used for sensitive variables to minimize the complexity of the assessment, and point estimates might be appropriate for other input variables. |
||
| Tools |
|
|
| Tools available for deterministic assessments include default inputs and methods established by EPA to help standardize point estimate calculations among sites. These assessments often use simple models and equations. Because probabilistic assessments sample input variables from distributions, the mathematical equations and computer models used to implement them are more complex. Monte Carlo Sensitivity analysis Using the results of a sensitivity analysis, a risk assessor can determine which variables have the most influence on the exposure estimate. The assessor might choose to find distributions for those variables so that a probabilistic assessment can be conducted. In a probabilistic assessment the sensitivity analysis provides a quantitative ranking of the influence of the variables based on varying multiple variables with probability distributions. |
||
| Results |
|
|
| Deterministic approaches produce a point estimate of exposure that falls somewhere within the full distribution of possible exposures. Carefully selected input values can provide assessors with meaningful estimates of central tendency or high-end exposures within a defined population. This approach is typically used in screening-level assessments in part due to the relatively economical and straightforward nature of the approach. Further, the results are simple to communicate. Characterization of uncertainty and variability is limited when using deterministic approaches, but can be approximated by conducting multiple deterministic runs. This gives the assessor an idea of uncertainty and/or variability by evaluating potential exposure based on several point estimates, using inputs from various points on the frequency distribution. Probabilistic assessments generate a distribution of possible exposure estimates that reflects the combined impact of variability of input parameters (U.S. EPA, 2001). This approach can provide a more comprehensive characterization of variability in exposure or risk estimates and uncertainty in input variables and identifies data gaps that can be evaluated further. Further, the exposure assessor has the ability to better characterize where (in the overall distribution of exposures) a high-end estimate falls (e.g., 90th, 99th, or further in the tail). Monte Carlo simulations and other probabilistic approaches can provide estimates of exposure, but doing a probabilistic assessment using Monte Carlo techniques may not be necessary in situations where risk or costs of remediation are low. Typically, stressors, exposure pathways, and receptors of highest potential concern are selected for a probabilistic approach to conserve resources. More effort is required by exposure assessors to communicate the methodology and results from a probabilistic assessment. Complexities of probabilistic approaches might obscure important assumptions or errors in basic exposure or risk models. Further, a probabilistic estimate is only as good as the underlying parameter distributions. If low quality data are used or important correlations are not accounted for, the results will be less informative. |
||
Tools for Developing Probabilistic Assessments
The tools in this table are all informational resources for developing probabilistic assessments. Tools for deterministic approaches are included in other Tool Sets on the home page.
Methods
Deterministic exposure assessments use a combination of point values selected to be either health-protective (i.e., high-end values) or to represent a “typical” exposure (i.e., central tendency values). They produce an exposure estimate that is also a point estimate that falls somewhere within the full distribution of possible exposures (U.S. EPA, 2004).
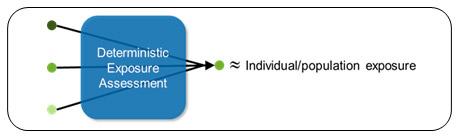 Deterministic assessments use point values to produce a point estimate of individual or population exposure.
Multiple iterations of an assessment can be conducted using the deterministic approach. For example, default point estimates can be used for a screening-level assessment to create a basic picture of high-end or typical exposures. If the results of the initial assessment are not sufficient for use in decision-making, a refined deterministic assessment can be completed using more site-specific data, if available, to create a more precise picture of expected exposures.
 |
||
|---|---|---|
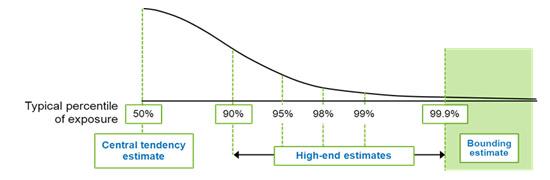
| Central Tendency Estimates |
|
|
| Bounding Estimates |
|
|
| High-End Estimates |
|
|
|
|
|
|
|
|
|
|
|
Probabilistic exposure assessments give the assessor flexibility in generating exposure estimates for the spectrum of high-end percentiles (e.g., from the 90th to 99.9th percentiles) from which the assessor can select the most appropriate upper-bound level (U.S. EPA, 2004). Many of the same algorithms and data distributions used to derive point estimates in deterministic assessments can also be used in probabilistic assessments.
To be health-protective, risk management decisions are often based on estimates of the high-end exposure to an individual. As the exposure estimate moves higher within the percentile range, the level of uncertainty increases.
Random variables are those variables like body weight, exposure frequency, and ingestion rate that are assumed to be independent of one another. They are expressed as probability distributions, which account for variability within the population. Any known correlations between variables are taken into account (e.g., food intake may be correlated with body weight).
The use of random variables allows for a unique estimate of exposure to be calculated by sampling each set of probability distributions and calculating a result. Each iteration of the calculation represents a plausible combination of input values and therefore a plausible estimate of exposure. However, the "individuals" represented in each iteration are not meant to represent a single person. Rather, the total distribution of exposure values is meant to demonstrate the likelihood or probability of different exposure levels within a population with characteristics and behaviors that vary.
Below are the steps an assessor might take to conduct a probabilistic approach.
Identify Variables to Evaluate Probabilistically
- Prior to carrying out a probabilistic assessment, the assessor decides which of the input variables are going to be evaluated probabilistically. Ideally, the model will use probability distributions for input variables that are uncertain or variable as identified by the sensitivity analyses. More often, the choices are limited by available data (U.S. EPA, 2004)
Select and Fit Distributions
- The assessor selects and fits the best distributions for the variables that will be input as probability distributions (see Input Data for more information and resources on selecting and fitting distributions).
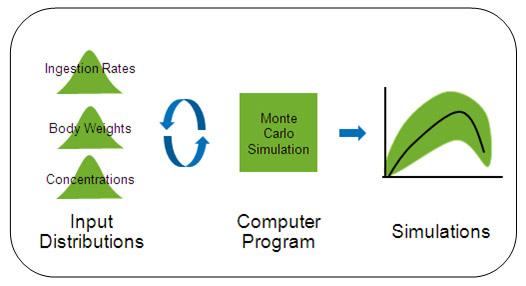
Sample the Probability Distributions
- The most popular (but not the only) approach to estimating exposure with probability distributions is the Monte Carlo simulation. A Monte Carlo simulation is "a technique for characterizing the uncertainty and variability in exposure estimates by repeatedly sampling the probability distributions of the exposure equation inputs and using these inputs to calculate a range of exposure values" (U.S. EPA, 2001).
Monte Carlo simulations can vary in complexity:- One-dimensional Monte Carlo Analysis (1-D MCA) "combine[s] point estimates and probability distributions to yield a probability distribution that characterizes variability or uncertainty in risks within a population" (U.S. EPA, 2001).
- Two-dimensional Monte Carlo Analysis (2-D MCA) “simultaneously characterize[s] variability and uncertainty in multiple variables and parameter estimates” and is typically employed in more refined assessments (U.S. EPA, 2001).
Many user-friendly programs are available for conducting Monte Carlo simulations. However, if the model is not appropriately parameterized or the input distributions are not appropriately defined, the results of a Monte Carlo simulation will not be useful. Some knowledge of probabilistic analysis and critical evaluation of the input distributions is therefore required to generate high-quality results using a Monte Carlo simulation tool.
 Source: (U.S. EPA, 2006)
Presenting the Results of Probabilistic Assessments
- Presenting the results of a probabilistic assessment can be challenging due to the complexity of the approach. In contrast, the results of a deterministic assessment are often simple to understand and a decision point for taking action is often clear. For example, if the point estimate of risk is above a certain level, take action. If not, another action or no action might be advised (U.S. EPA, 2004).
The results of a probabilistic assessment are not as intuitive to interpret. The distribution of exposures or risks should be characterized as representing variability among the population based on differences in exposure (U.S. EPA, 2004).
U.S. EPA (2004) recommends early and continuous involvement with stakeholders, including a communication plan, and developing effective graphics to ensure the results are understood by affected parties (U.S. EPA, 2004). Further, information might be presented in multiple ways (e.g., using probability density functions and cumulative density functions) to communicate the results effectively.
- Chapter 31 – Probabilistic Risk Assessment in ATRA Volume I (U.S. EPA, 2004) and Chapter 6 – Exposure Assessment in RAGS Volume 1 (U.S. EPA, 1989) include discussions of factors to consider when presenting the results of a probabilistic assessment. Hypothetical results showing probability density and cumulative density functions are also included in this chapter.
Tools for Conducting Probabilistic Assessments
The tools in this table are all models that can be used to conduct probabilistic assessments. Tools for deterministic approaches are included in other Tool Sets on the home page.
Input Data
Deterministic Assessments
Descriptions of the data sources that can be used in deterministic assessments can be found in multiple Tool Sets on the home page. In fact, the Indirect Estimation (Scenario Evaluation) module of the Approaches Tool Set includes the following categories for input data:
- Sources and Releases
- Fate and Transport
- Concentrations
- Characterizing Populations
- Exposure Factors
Tools related to input data for fate and transport, concentrations, and exposure factors are also described in the Media and Routes Tool Sets.
Probabilistic Assessments
Some of the input values for a probabilistic assessment will be data distributions instead of single values. However, selecting and fitting probability distributions for all of the input variables is often unnecessary since it can require considerable resources and might not increase the accuracy of the exposure assessment.
Ideally, only those input variables found to contribute significantly to the overall variability and uncertainty as determined by the sensitivity analysis should be considered to include as probability distributions (U.S. EPA, 2001).
Steps for Selecting and Fitting Probability Distributions:
- Hypothesize a family of distributions
- Assess quality of fit of distribution
- Estimate distribution parameters
- Assess quality of fit of parameters
Appendix B of RAGS Volume 3, Part A (U.S. EPA, 2001)
When fitting the data to a distribution, exposure assessors might consider a variety of distributions or mathematical functions (e.g., normal, lognormal, uniform, Poisson, beta). Often more than one probability distribution may appear to be suitable. U.S. EPA (2001) recommends using a step-wise, tiered approach for incorporating probability distributions in a probabilistic assessment. Appendix B of RAGS Volume 3, Part A (U.S. EPA, 2001) reviews the methods available to select and fit distributions and includes guidance based on the questions the assessment is intended to answer and the data available to define the input variables.
Similar to a point estimate approach, different sites may require different probability distributions for input variables, depending on the unique risk management issues and sources of uncertainty (U.S. EPA, 2001). U.S. EPA’s (1997b) Guiding Principles for Monte Carlo Analysis also includes guidance for assessors on selecting input data and distributions for probabilistic assessments.
U.S. EPA (2000) Options for Development of Parametric Probability Distributions for Exposure Factors provides guidance for selecting probability distributions and fitting data from the 1997 edition of the Exposure Factors Handbook (U.S. EPA, 1997a). Three factors-tap water intake, population mobility, and inhalation rules-are used as test cases in the document and recommendations on the mathematical models that best fit the data are provided.
Applications
Since assessments using probabilistic methods are less common than those using deterministic ones, several probabilistic assessment examples are described below.
-
A Probabilistic Exposure Assessment for Children Who Contact CCA-treated Playsets and Decks Using the Stochastic Human Exposure and Dose Simulation Model for the Wood Preservative Scenario (SHEDS-Wood) (Zartarian et al., 2005).
- The SHEDS model is a probabilistic model that can be used to assess aggregate exposures and multimedia, multipathway chemicals of interest. EPA refined the SHEDS model (i.e., SHEDS-Wood) to estimate children’s exposure to chromium and arsenic residues from playsets and decks treated with chromate copper arsenate (CCA) (Zartarian et al., 2005).
- Using the probabilistic SHEDS-Wood model EPA was able to:
- address both variability and uncertainty in model inputs and outputs;
- generate a time series of exposure with high resolution of results;
- conduct comprehensive sensitivity analyses to identify critical model inputs and factors contributing the most to model predictions; and
- derive a more realistic estimate of exposure by incorporating specific information on activities related to exposure (e.g., diary surveys related to deck and playset contact) and addressing the effect of scenarios that reduce exposure (e.g., hand washing after play).
- Details on the methods, assumptions, and results are provided in the report. The absorbed doses, including average daily doses (ADDs) and lifetime average daily doses (LADDs) presented in this report were used to generate estimates of children’s risk from exposure to chromium and arsenic residues in a separate report (Dang et al., 2003).
-
Comparison of Four Probabilistic Models (CARES, Calendex, ConsExpo, SHEDS) to Estimate Aggregate Residential Exposures to Pesticides (Young et al., 2012)
- Young et al. (2012) compared the results of six exposure estimates including those derived from two deterministic approaches and four probabilistic approaches. These approaches were used for predicting children’s indoor exposure to pesticides through inhalation, dermal, and non-dietary pathways for selected scenarios. The two deterministic approaches evaluated in this study were EPA’s Residential Standard Operating Procedures and the Draft Protocol for Measuring Children’s Non-Occupational Exposure to Pesticides by all Relevant Pathways. More information on the probabilistic models (i.e., CARES®, Calendex™, ConsExpo, and SHEDS) used in this study are found in Tools for Conducting Probabilistic Assessments.
- The authors’ objective in comparing multiple approaches was to provide an indication of each model’s reliability, shed light on their underlying assumptions, and compare the range of exposure estimates. The paper provides a discussion of each approach and model including how the algorithms vary. Young et al. (2012) found that the differences identified can be explained by activity assumptions, input distributions, and exposure algorithms.
- Smith (1994) published results comparing risk estimates for exposure to volatile solvents via ingestion and dermal contact. Risk estimates generated using probabilistic methods were compared to those calculated using the deterministic “reasonable maximum exposure” approach. The deterministic estimate was in the high end of the range of probabilistic estimates.
References
- Smith, RL. (1994). Use of Monte Carlo simulation for human exposure assessment at a Superfund site. Risk Anal 14: 433-439.
- U.S. EPA. (1989). Risk Assessment Guidance for Superfund: Volume 1: Human Health Evaluation Manual (Part A). (EPA/540/1-89/002). Washington, DC.
- U.S. EPA. (1992). Guidelines for Exposure Assessment. (EPA/600/Z-92/001). Washington, DC.
- U.S. EPA. (1997a). Exposure Factors Handbook. (EPA/600/P-95/002Fa-c). Washington, DC.
- U.S. EPA. (1997b). Guiding Principles for Monte Carlo Analysis. (EPA/630/R-97/001). Washington, DC.
- U.S. EPA. (2000). Options for Development of Parametric Probability Distributions for Exposure Factors. (EPA/600/R-00/058). Washington, DC.
- U.S. EPA. (2001). Risk Assessment Guidance for Superfund (RAGS): Volume III - Part A: Process for Conducting Probabilistic Risk Assessment. (EPA 540-R-02-002). Washington, DC.
- U.S. EPA. (2005). A probabilistic exposure assessment for children who contact CCA-treated playsets and decks: Using the stochastic human exposure and dose simulation model for the wood preservative exposure scenario (SHEDS-Wood). Research Triangle Park, NC.
- U.S. EPA. (2004). Air Toxics Risk Assessment Reference Library: Volume 1: Technical Resource Manual. (EPA-453-K-04-001A). Research Triangle Park, NC.
- U.S. EPA. (2006). Approaches for the application of physiologically based pharmacokinetic (PBPK) models and supporting data in risk assessment. (EPA/600/R-05/043F). Washington, DC.
- Young, BM; Tulve, NS; Egeghy, PP; Driver, JH; Zartarian, VG; Johnston, JE; Delmaar, CJ; Evans, JJ; Smith, LA; Glen, G; Lunchick, C; Ross, JH; Xue, J; Barnekow, DE. (2012). Comparison of Four Probabilistic Models (CARES, Calendex, ConsExpo, and SHEDS) to Estimate Aggregate Residential Exposures to Pesticides Exit. J Expo Sci Environ Epidemiol 22: 522-532.