Durable Goods: Product-Specific Data
EPA defines durable goods as products with a lifetime of three years or more, although there are some exceptions. In this EPA analysis, the durable goods category includes large and small appliances, furniture and furnishings, carpets and rugs, rubber tires, lead-acid automotive batteries, consumer electronics, and other miscellaneous durable goods such as luggage, sporting goods and household goods.
EPA measures the generation, recycling, composting, combustion with energy recovery and landfilling of durable goods. This web page is a brief summary of data that is specific to durable goods. For more comprehensive information on this category of municipal solid waste (MSW), see the 2018 Data Tables on the Advancing Sustainable Materials Management: Facts and Figures Report page.
On this page:
- Overview of Durable Goods
- Major Appliances
- Small Appliances
- Furniture and Furnishings
- Carpets and Rugs
- Vehicle Tires
- Lead Acid Batteries
- Total Miscellaneous Durable Goods
- Electronics
- Other Miscellaneous Durable Goods
Overview of Durable Goods
 Managers of MSW facilities often call durable goods oversized and bulky. Facilities handle these goods in a somewhat different manner than other components of MSW. These goods are often picked up separately and typically they are not mixed with other MSW at the facility. A wide variety of materials make up durable goods. In 2018, in order of decreasing tonnage, the most common materials in durable goods of MSW included: ferrous metals, plastics, rubber and leather, wood, textiles, other nonferrous metals (e.g., lead, copper), glass and aluminum.
As of 2018, the generation of durable goods in MSW was 57.1 million tons (19.5 percent of total MSW generation). That year, 10.6 million tons of durable goods were recycled (18.5 percent recycling rate). Additionally, the combustion of durable goods was 9.1 million tons (26.4 percent of total combustion with recovery), and landfills received 37.4 million tons (25.6 percent of total landfilling) in 2018.
The data in the table below are from 1960 to 2018, relating to the total number of tons of all durable goods generated, recycled, composted, combusted with energy recovery and landfilled.
| Management Pathway | 1960 | 1970 | 1980 | 1990 | 2000 | 2005 | 2010 | 2015 | 2017 | 2018 |
|---|---|---|---|---|---|---|---|---|---|---|
| Generated | 9,920 | 14,660 | 21,800 | 29,810 | 38,870 | 45,060 | 49,350 | 53,940 | 56,870 | 57,100 |
| Recycled | 350 | 940 | 1,360 | 3,460 | 6,580 | 7,970 | 9,390 | 9,880 | 10,550 | 10,570 |
| Composted | - | - | - | - | - | - | - | - | ||
| Combustion with Energy Recovery | - | 60 | 440 | 4,480 | 6,260 | 6,750 | 7,070 | 8,640 | 9,080 | 9,120 |
| Landfilled | 9,570 | 13,660 | 20,000 | 21,870 | 26,030 | 30,340 | 32,890 | 35,420 | 37,240 | 37,410 |
A dash in the table means that data is not available.
Major Appliances
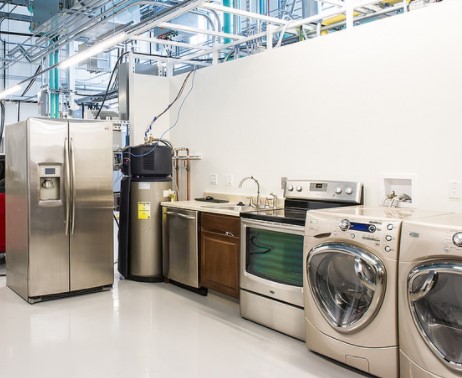
Major appliances or white goods, in MSW include items such as refrigerators, washing machines and water heaters. Data on unit production of appliances are from Appliance Manufacturer Market Profile, Appliance Manufacturer Shipments Forecasts, and Appliance Statistical Review.
In 2018, generation was 5.3 million tons, or 1.8 percent of total MSW generation. While the number of units of appliances is higher than previous years, the average weight per unit is lower. Ferrous metals (steel and iron) are the predominant materials in major appliances, but different metals, plastics, glass and other materials are also present.
Data on the recovery of ferrous metals from major appliances are from a survey conducted by the Steel Recycling Institute. This survey estimates the recovery of ferrous metals from shredded appliances to be 3.1 million tons in 2018, leaving 2.1 million tons of appliances to be landfilled. Major appliances are not accepted at combustion facilities with energy recovery.
Composting and combustion for energy recovery data for major appliances is negligible and was not included.
The data in the table below are from 1960 to 2018, relating to the total number of tons of major appliances generated, recycled, composted, combusted with energy recovery and landfilled.
| Management Pathway | 1960 | 1970 | 1980 | 1990 | 2000 | 2005 | 2010 | 2015 | 2017 | 2018 |
|---|---|---|---|---|---|---|---|---|---|---|
| Generated | 1,630 | 2,170 | 2,950 | 3,310 | 3,640 | 3,610 | 4,020 | 4,860 | 5,160 | 5,250 |
| Recycled | 10 | 50 | 130 | 1,070 | 2,000 | 2,420 | 2,610 | 3,000 | 3,110 | 3,140 |
| Composted | - | - | - | - | - | - | - | - | - | - |
| Combusted with Energy Recovery | - | - | - | - | - | - | - | - | - | - |
| Landfilled | 1,620 | 2,120 | 2,820 | 2,240 | 1,640 | 1,190 | 1,410 | 1,860 | 2,050 | 2,110 |
Sources: Appliance Manufacturer Market Profile, Appliance Manufacturer Shipments Forecasts, Appliance Statistical Review and Steel Recycling Institute.
A dash in the table means that data is not available.
Small Appliances
This category includes items such as toasters, hair dryers and electric coffee pots. Information on shipments of small appliances is from Department of Commerce data, Annual Appliance Industry Forecasts, and Appliance Statistical Review. Information on weights and the material composition of discarded small appliances comes from manufacturer specifications and interviews. In 2018, EPA estimated that the generation of small appliances was about 2.2 million tons. After magnetic separation, a small amount of ferrous metals in small appliances was recycled.
EPA estimated that of the 2.2 million tons of small appliance waste generated, only about 5.6 percent was recycled. A small proportion of small appliances were combusted for energy recovery (18.5 percent), while the majority (75.9 percent) were landfilled.
The data in the table below are from 1960 to 2018, relating to the total number of tons of small appliances generated, recycled, composted, combusted with energy recovery and landfilled.
| Management Pathway | 1960 | 1970 | 1980 | 1990 | 2000 | 2005 | 2010 | 2015 | 2017 | 2018 |
|---|---|---|---|---|---|---|---|---|---|---|
| Generated | - | - | - | 460 | 1,040 | 1,180 | 1,830 | 2,050 | 2,120 | 2,160 |
| Recycled | - | - | - | 10 | 20 | 20 | 120 | 120 | 120 | 120 |
| Composted | - | - | - | - | - | - | - | - | - | - |
| Combustion with Energy Recovery | - | - | - | 90 | 200 | 200 | 310 | 380 | 390 | 400 |
| Landfilled | - | - | - | 360 | 820 | 960 | 1,400 | 1,550 | 1,610 | 1,640 |
A dash in the table means that data is not available.
Furniture and Furnishings
Furniture and furnishings include items such as sofas, tables, chairs and mattresses. EPA used data on sales of furniture and furnishings from the Department of Commerce for this analysis.
To measure the generation of furniture and furnishings, EPA counted products at the end-of-life (after primary use and reuse by secondary owners). Generation of furniture and furnishings in MSW was 12.1 million tons in 2018 (4.1 percent of total MSW), up from 2.2 million tons in 1960. Wood was the largest material category in furniture, and ferrous metals was the second largest category. Plastics, glass, textiles and other materials were also found in furniture. Although the recovery of wood, textiles and metals may be occurring, no measurable data source was accessible, with the exception of mattresses.
A significant proportion (19.5 percent) of furniture and furnishings was combusted for energy recovery in 2018, but the majority of this product sector was landfilled (80.1 percent).
The data in the table below are from 1960 to 2018, relating to the total number of tons of furniture and furnishings generated, recycled, composted, combusted with energy recovery and landfilled.
| Management Pathway | 1960 | 1970 | 1980 | 1990 | 2000 | 2005 | 2010 | 2015 | 2017 | 2018 |
|---|---|---|---|---|---|---|---|---|---|---|
| Generated | 2,150 | 2,830 | 4,760 | 6,790 | 8,120 | 9,340 | 10,820 | 12,050 | 12,210 | 12,080 |
| Recycled | - | - | - | - | - | - | 10 | 10 | 40 | 40 |
| Composted | - | - | - | - | - | - | - | - | - | - |
| Combustion with Energy Recovery | - | - | 90 | 1,150 | 1,570 | 1,700 | 1,910 | 2,350 | 2,380 | 2,360 |
| Landfilled | 2,150 | 2,830 | 4,670 | 5,640 | 6,550 | 7,640 | 8,900 | 9,690 | 9,790 | 9,680 |
Sources: Department of Commerce, International Sleep Products Association and Mattress Recycling Council.
A dash in the table means that data is not available.
Carpets and Rugs
EPA estimated that the generation of carpets and rugs in MSW was 3.4 million tons in 2018, representing 1.2 percent of total generation. This is based on data from past carpet sales from the Department of Commerce's Current Industrial Report Carpet and Rug Series.
Based on industry data, EPA estimated that the recycling of carpet fiber, backing and padding was 310,000 tons in 2018, which was 9.2 percent of carpet generation. A slightly larger proportion (17.8 percent) was combusted for energy recovery, while the majority of rugs and carpets were landfilled (73 percent).
The data in the table below are from 1960 to 2018, relating to the total number of tons of carpets and rugs generated, recycled, composted, combusted with energy recovery and landfilled.
| Management Pathway | 1960 | 1970 | 1980 | 1990 | 2000 | 2005 | 2010 | 2015 | 2017 | 2018 |
|---|---|---|---|---|---|---|---|---|---|---|
| Generated | - | - | - | 1,660 | 2,460 | 2,960 | 3,720 | 3,630 | 3,390 | 3,370 |
| Recycled | - | - | - | - | 190 | 250 | 270 | 190 | 280 | 310 |
| Composted | - | - | - | - | - | - | - | - | - | - |
| Combustion with Energy Recovery | - | - | - | 290 | 440 | 490 | 610 | 670 | 610 | 600 |
| Landfilled | - | - | - | 1,370 | 1,830 | 2,220 | 2,840 | 2,770 | 2,500 | 2,460 |
Sources: Department of Commerce's Current Industrial Report Carpet and Rug Series, Carpet Cushion Council, and Carpet America Recovery Effort.
A dash in the table means that data is not available.
Vehicle Tires
EPA estimated the generation of rubber tires was 6.5 million tons in 2018, approximately 2.2 percent of total MSW. EPA only included tires from passenger cars, trucks and motorcycles in these figures. Tires used in large equipment, aviation or industrial applications were not included.
The Agency also estimated the tire recycling rate was 40.0 percent based on data on the recovery of tires from the U.S. Tire Manufacturers Association. Tires recovered for fuel were not included in this analysis. However, tires going to combustion facilities as fuel were included in the combustion estimates.
In 2018, the amount of tires combusted with energy recovery was 2.7 million tons (41.5 percent of tire generation). That same year, landfills received about 1.2 million tons of tires (18.5 percent of tire generation).
The data in the table below are from 1960 to 2018, relating to the total number of tons of vehicle tires generated, recycled, composted, combusted with energy recovery and landfilled.
| Management Pathway | 1960 | 1970 | 1980 | 1990 | 2000 | 2005 | 2010 | 2015 | 2017 | 2018 |
|---|---|---|---|---|---|---|---|---|---|---|
| Generation | 1,120 | 1,890 | 2,720 | 3,610 | 4,930 | 4,910 | 5,130 | 5,970 | 6,540 | 6,530 |
| Recycled | 330 | 250 | 150 | 440 | 1,290 | 1,640 | 2,270 | 2,410 | 2,610 | 2,610 |
| Composted | - | - | - | - | - | - | - | - | - | - |
| Combustion with Energy Recovery | - | - | 30 | 400 | 2,260 | 2,390 | 2,000 | 2,840 | 2,710 | 2,710 |
| Landfilled | 790 | 1,640 | 2,540 | 2,770 | 1,380 | 880 | 860 | 720 | 1,220 | 1,210 |
Sources: U.S. Department of Commerce International Trade Commission, U.S. Tire Manufacturers Association, National Automobile Dealers Association and Modern Tire Dealer Magazine.
A dash in the table means that data is not available.
Lead Acid Batteries
EPA estimated that the generation of lead-acid batteries from automobiles, trucks and motorcycles in MSW in 2018 was 2.9 million tons (1.0 percent of total generation).
The Agency estimated that in 2018, the recycling rate for the lead in these batteries, as well as the polypropylene battery casings, was 99 percent. (Recyclers remove some electrolytes and other materials in batteries from the municipal solid waste stream, along with recovered lead and polypropylene. EPA counts these materials as “recovered,” along with the recyclable materials.) Less than 1 percent of lead acid batteries were landfilled. Lead acid batteries are not accepted at combustion facilities.
The data in the table below are from 1960 to 2018, relating to the total number of tons of lead acid batteries generated, recycled, composted, combusted with energy recovery and landfilled.
| Management Pathway | 1960 | 1970 | 1980 | 1990 | 2000 | 2005 | 2010 | 2015 | 2017 | 2018 |
|---|---|---|---|---|---|---|---|---|---|---|
| Generation | - | 820 | 1,490 | 1,510 | 2,280 | 2,750 | 3,020 | 2,700 | 2,940 | 2,900 |
| Recycled | - | 620 | 1,040 | 1,470 | 2,130 | 2,640 | 2,980 | 2,670 | 2,910 | 2,870 |
| Composted | - | - | - | - | - | - | - | - | - | - |
| Combustion with Energy Recovery | - | - | - | - | - | - | - | - | - | - |
| Landfilled | - | 200 | 450 | 40 | 150 | 110 | 40 | 30 | 30 | 30 |
Sources: Battery Council International, the Census Bureau and the National Automobile Dealers Association.
A dash in the table means that data is not available.
Total Miscellaneous Durable Goods
"Electronics" plus “Other Miscellaneous Durable Goods” equals “Total Miscellaneous Durable Goods.” Miscellaneous durable goods include consumer electronics such as television sets, videocassette recorders, personal computers, luggage and sporting equipment. An estimated 24.8 million tons of these goods were generated in 2018, amounting to 8.5 percent of MSW generated.
The total miscellaneous durable goods category includes ferrous metals, as well as plastics, glass, rubber, wood and other metals. Pre-combustion and post-combustion magnetic separation has a positive impact on this category, bringing total recovery from all recycling pathways to about 1.5 million tons. An estimated three million tons were combusted with energy recovery (12.3 percent of generation) and 20 million tons of total miscellaneous durable goods were landfilled in 2018 (81.7 percent of total miscellaneous durable goods generation).
The data in the table below are from 1960 to 2018, relating to the total number of tons of total miscellaneous durable goods generated, recycled, composted, combusted with energy recovery and landfilled.
| Management Pathway | 1960 | 1970 | 1980 | 1990 | 2000 | 2005 | 2010 | 2015 | 2017 | 2018 |
|---|---|---|---|---|---|---|---|---|---|---|
| Generation | 5,020 | 6,950 | 9,880 | 12,470 | 16,400 | 20,310 | 20,810 | 22,680 | 24,510 | 24,810 |
| Recycled | 10 | 20 | 40 | 470 | 950 | 1,000 | 1,130 | 1,480 | 1,480 | 1,480 |
| Composted | - | - | - | - | - | - | - | - | - | - |
| Combustion with Energy Recovery | - | 60 | 320 | 2,550 | 1,790 | 1,970 | 2,240 | 2,400 | 2,990 | 3,050 |
| Landfilled | 5,010 | 6,870 | 9,520 | 9,450 | 13,660 | 17,340 | 17,440 | 18,800 | 20,040 | 20,280 |
A dash in the table means that data is not available.
Electronics
EPA measures electronics in MSW primarily as part of the larger category, "Miscellaneous Durable Goods." One subcategory, “Selected Consumer Electronics,” includes products such as TVs, VCRs, DVD players, video cameras, stereo systems, telephones and computer equipment.
EPA estimated that the generation of consumer electronics goods in 2018 was 2.7 million tons, representing less than 1 percent of all MSW generation. In 2018, the rate of selected consumer electronics recycling was 38.5 percent.
EPA does not currently have information on the amount of selected consumer electronics that facilities combusted with energy recovery or sent to landfills in 2018. These products are included in Total Miscellaneous Durables.
The data in the table below are from 1960 to 2018, relating to the total number of tons of electronics generated, recycled, composted, combusted with energy recovery and landfilled.
| Management Pathway | 1960 | 1970 | 1980 | 1990 | 2000 | 2005 | 2010 | 2015 | 2017 | 2018 |
|---|---|---|---|---|---|---|---|---|---|---|
| Generation | - | - | - | - | 1,900 | 2,630 | 3,120 | 3,100 | 2,840 | 2,700 |
| Recycled | - | - | - | - | 190 | 360 | 650 | 1,230 | 1,020 | 1,040 |
| Composted | - | - | - | - | - | - | - | - | - | - |
| Combusted with Energy Recovery | - | - | - | - | - | - | - | - | - | - |
| Landfilled | - | - | - | - | - | - | - | - | - | - |
Sources: National Center for Electronics Recycling; Statistsa and Appliance Design Magazine.
A dash in the table means that data is not available.
Other Miscellaneous Durable Goods
These include items such as luggage and sporting equipment.
The data in the table below are from 1960 to 2018, relating to the total number of tons of other miscellaneous durable goods generated, recycled, composted, combusted with energy recovery and landfilled.
EPA does not currently have information on the amount of other miscellaneous durable goods that facilities combusted with energy recovery or sent to landfills in 2018. These products are included in Total Miscellaneous Durables.
| Management Pathway | 1960 | 1970 | 1980 | 1990 | 2000 | 2005 | 2010 | 2015 | 2017 | 2018 |
|---|---|---|---|---|---|---|---|---|---|---|
| Generation | - | - | - | - | 14,500 | 17,680 | 17,690 | 19,580 | 21,670 | 22,110 |
| Recycled | - | - | - | - | 760 | 640 | 480 | 250 | 460 | 440 |
| Composted | - | - | - | - | - | - | - | - | - | - |
| Combustion with Energy Recovery | - | - | - | - | - | - | - | - | - | - |
| Landfilled | - | - | - | - | - | - | - | - | - | - |
A dash in the table means that data is not available.