Food: Material-Specific Data
In 2020, EPA revised its wasted food measurement methodology, expanding the scope to include additional generators and management pathways. EPA’s 2018 estimates are the first set of estimates that utilize the enhanced measurement methodology.
EPA includes estimates of wasted food generation from the residential, commercial and institutional sectors, as well as estimates of how it is managed through several pathways, including:
- animal feed;
- bio-based materials/biochemical processing;
- codigestion/anaerobic digestion;
- composting/aerobic processes;
- controlled combustion;
- donation;
- land application;
- landfill; and
- sewer/wastewater treatment.
Estimates of wasted food generated by the industrial sector (i.e., food and beverage manufacturing and processing) is not included in the Facts and Figures report, as it is considered outside the scope of municipal solid waste (MSW). However, EPA does estimate industrial sector wasted food generation and management, and those estimates are published separately in the 2018 Wasted Food Report.
This web page is a brief summary of food material-specific data. For more comprehensive information, see the 2018 Data Tables on the Advancing Sustainable Materials Management: Facts and Figures Report page.
On this page:
Overview
EPA measures the generation and management of wasted food in MSW.
EPA includes the following generating sectors in the Facts and Figures report:
- the residential sector;
- the commercial sector, which includes:
- food retail/wholesale sectors, including supermarkets, supercenters, and food wholesalers;
- hospitality sectors, including restaurants/food services, hotels, and sports venues;
- the institutional sector, which includes:
- hospitals,
- nursing homes,
- military installations,
- office buildings,
- correctional facilities,
- colleges and universities, and K-12 schools; and
- food banks.
Residential wasted food generation is estimated by establishing a nationwide per capita estimate that is based on curbside sampling studies from across the United States and then applied to the U.S. population. The commercial and institutional wasted food generation estimates are based on dozens of industry-specific studies from across the nation.
The studies provide equations expressing generation rates which, when paired with national, industry-specific business statistics (e.g., U.S. Census-reported sales revenue, number of employees, number of hospital beds, number of students) result in industry-specific national annual wasted food generation rates. An average generation rate is then calculated for each industry, and these values are summed to calculate overall commercial or institutional sector estimates of wasted food generated. The national generation estimates in the Facts and Figures report are derived by adding the figures calculated for the residential, commercial and institutional sectors. EPA estimates that 63.1 million tons of food waste was generated in the commercial, institutional, and residential sectors in 2018, which is 21.6 percent of total MSW generation.
To estimate how each sector manages wasted food, EPA relied on various industry-specific studies, as well as facility-reported Anaerobic Digestion data and state-reported composting data.
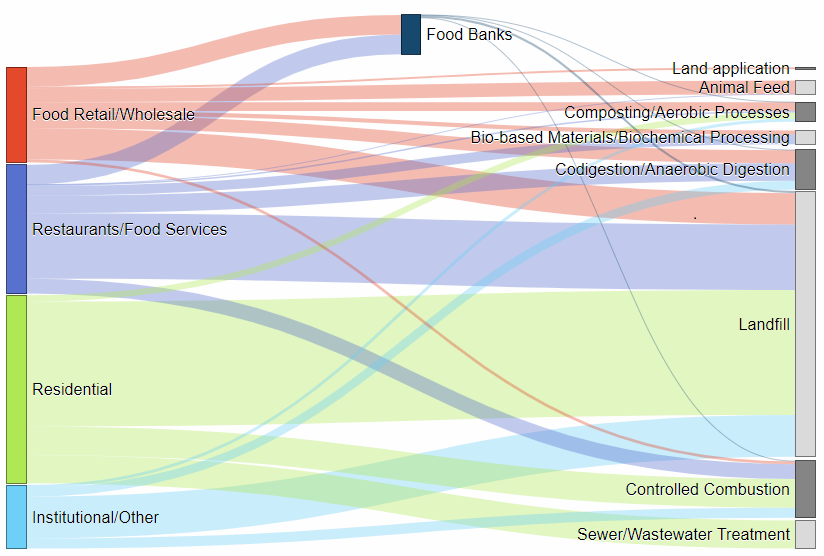
The following diagram depicts the flow of wasted food from generator sectors to the management pathways.
WASTED FOOD GENERATION AND MANAGEMENT FLOWS (2018)
The following table summarizes estimates of how much wasted food was managed by each pathway.
WASTED FOOD MANAGEMENT ESTIMATES (2018)
| MANAGEMENT PATHWAY | QUANTITY MANAGED (TONS) | PERCENTAGE MANAGED |
|---|---|---|
| Animal Feed | 1,814,984 | 2.9% |
| Codigestion/Anaerobic Digestion | 5,262,857 | 8.3% |
| Composting/Aerobic Processes | 2,592,566 | 4.1% |
| Bio-based Materials/Biochemical Processing | 1,841,411 | 2.9% |
| Donation | 4,787,378 | 7.6% |
| Land Application | 259,448 | 0.4% |
| Sewer/Wastewater Treatment | 3,743,229 | 5.9% |
| Landfill | 35,277,543 | 55.9% |
| Controlled Combustion | 7,552,705 | 12.0% |
| TOTAL | 63,132,123 | 100% |
EPA’s enhanced methodology results in higher wasted food generation estimates compared to previous year estimates due to the expanded scope (i.e., additional generators in the commercial and institutional sectors and additional management pathways). However, the percentage of food landfilled in the commercial, institutional, and residential sectors is lower than previous year estimates: 55.9 percent in 2018, compared to 75.31 percent in 2017. The estimated 35.3 million tons of wasted food that went to landfills in 2018 represents 24.1 percent of all MSW landfilled.
Please see the 2018 Waste Food Report and the Wasted Food Measurement Methodology Scoping Memo (2020) (PDF) (100 pp, 1.5 MB) for further information on estimating the generation and management of food waste.
Summary Table and Graph
The data below are from 1960 to 2018, relating to the total number of tons of food generated, recycled, composted, combusted with energy recovery and landfilled.
| Management Pathway | 1960 | 1970 | 1980 | 1990 | 2000 | 2005 | 2010 | 2015 | 2017 | 2018 |
|---|---|---|---|---|---|---|---|---|---|---|
| Generation | 12,200 | 12,800 | 13,000 | 23,860 | 30,700 | 32,930 | 35,740 | 39,730 | 40,670 | 63,130 |
| Recycled | - | - | - | - | - | - | - | - | - | - |
| Composted | - | - | - | - | 680 | 690 | 970 | 2,100 | 2,570 | 2,590 |
| Other Food Management | - | - | - | - | - | - | - | - | - | 17,710 |
| Combustion with Energy Recovery | - | 50 | 260 | 4,060 | 5,820 | 5,870 | 6,150 | 7,380 | 7,470 | 7,550 |
| Landfilled | 12,200 | 12,750 | 12,740 | 19,800 | 24,200 | 26,370 | 28,620 | 30,250 | 30,630 | 35,280 |
*Note that 2018 was the first year for which EPA used a new methodology, so the generation estimates increased due to the expanded scope of the new methodology.
Sources: EPA estimated wasted food generation from residential, commercial and institutional sources, using data from sampling studies and industry-specific studies in various parts of the country in combination with demographic data on population and national, industry-specific business statistics. Management pathway estimates relied on various industry-specific studies, as well as facility-reported Anaerobic Digestion data and state-reported composting data.
A dash in the table means that data is not available.
2018 Wasted Food Report
This Report describes the enhanced measurement methodology used to calculate the 2018 wasted food estimates, and provides detailed estimates of generation and management by sector. The Report includes estimates for the commercial, residential and institutional sectors (which are contained in the Facts and Figures Report), as well as the industrial sector (i.e., food and beverage manufacturing and processing), which is not included in the Facts and Figures Report, but is an important part of the food system.
Wasted Food Measurement Methodology Scoping Memo
In 2017, EPA set out to revise its food measurement methodology to more fully capture flows of excess food and food waste throughout the food system, and to provide more granular annual estimates of generation and management of excess food and food waste to the public. This Scoping Memo describes the measurement methodology EPA has used to date, as well as the enhanced methodology that EPA developed between 2017 and 2019. The enhanced methodology examined the following management pathways, which significantly expand the scope beyond EPA’s previous set of management pathways for food waste (i.e., composting, landfill, and combustion):
- animal feed;
- bio-based materials/biochemical processing;
- codigestion/anaerobic digestion;
- composting/aerobic processes;
- controlled combustion;
- donation
- land application;
- landfill; and
- sewer/wastewater treatment.
This enhanced methodology was used to calculate sector-specific estimates of excess food and food waste generation, as well as estimates of how much excess food and food waste was sent to each management pathway, for the year 2016. This Scoping Memo provides detail on the methodologies and studies used, the resulting 2016 estimates, and describes how EPA plans to use the enhanced methodology in its estimates for the “Advancing Sustainable Materials Management: Facts and Figures” report.
- Wasted Food Measurement Methodology Scoping Memo (2020) (PDF) (100 pp, 1.5 MB)