Nondurable Goods: Product-Specific Data
The Department of Commerce defines nondurable goods as products with a lifetime of less than three years. EPA followed this definition to the greatest extent possible for this analysis.
EPA measures the generation, recycling, combustion with energy recovery and landfilling of nondurable goods. For more comprehensive information on this category of municipal solid waste (MSW), see the 2018 Data Tables on the Advancing Sustainable Materials Management: Facts and Figures Report page.
On this page:
- Overview of Nondurable Goods
- Paper and Paperboard Products
- Plastic Plates and Cups
- Trash Bags
- Disposable Diapers
- Clothing and Footwear
- Towels, Sheets and Pillowcases
- Other Miscellaneous Nondurable Goods
Overview of Nondurable Goods
 Products made of paper and paperboard comprise the largest portion of nondurable goods. Other nondurable products include paper and plastic plates, cups and other disposable food service products, disposable diapers, clothing and footwear, linens, and other miscellaneous products.
Generation of nondurable goods in MSW was 50.4 million tons in 2018 (17.3 percent of total generation). The recycling of nondurable paper products in this category was quite significant, resulting in the total nondurable goods recovery of 14.2 million tons in 2018 (28.1 percent of nondurables generation). Additionally, the combustion of nondurable goods was 7.1 million tons (20.5 percent of total combustion with energy recovery), and landfills received 29.2 million tons (19.9 percent of total landfilling) in 2018.
The data in the table below are from 1960 to 2018, relating to the total number of tons of all nondurable goods generated, recycled, composted, combusted with energy recovery and landfilled.
| Management Pathway | 1960 | 1970 | 1980 | 1990 | 2000 | 2005 | 2010 | 2015 | 2017 | 2018 |
|---|---|---|---|---|---|---|---|---|---|---|
| Generation | 17,330 | 25,060 | 34,420 | 52,170 | 64,010 | 63,650 | 53,250 | 51,810 | 50,700 | 50,440 |
| Recycled | 2,390 | 3,730 | 4,670 | 8,800 | 17,560 | 19,770 | 19,190 | 16,190 | 16,290 | 14,190 |
| Composted | - | - | - | - | - | - | - | - | - | - |
| Combustion with Energy Recovery | - | 90 | 580 | 7,380 | 9,000 | 7,980 | 6,030 | 6,960 | 6,720 | 7,090 |
| Landfilled | 14,940 | 21,240 | 29,170 | 35,990 | 37,450 | 35,900 | 28,030 | 28,660 | 27,690 | 29,160 |
A dash in the table means that data is not available.
Paper and Paperboard Products
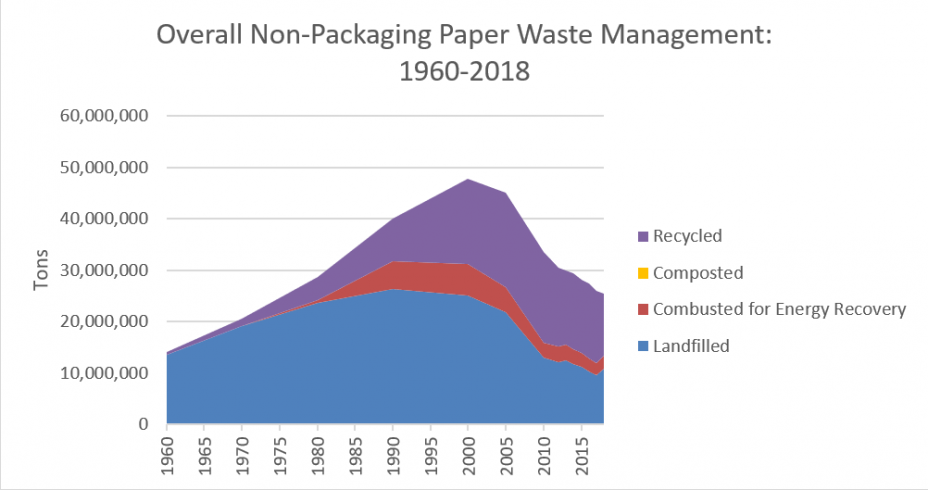 EPA estimated in 2018 that the generation of paper and paperboard nondurable products was 26 million tons. This statistic includes many different paper and paperboard product categories. The data in the table to the right are from 1960 to 2018, relating to the total number of tons of overall non-packaging paper waste generated, recycled, composted, combusted with energy recovery and landfilled.
The category with the highest rate of recovery was newspapers, but the recycling of other paper products, such as books, magazines, office papers, directories, marketing mail and other commercial printing also occurred, and the overall recycling rate for paper in nondurables was 47.4 percent in 2018. The amount of paper in nondurables combusted for energy recovery in 2018 was 2.6 million tons, and landfills received 10.8 million tons that year.
With the exception of newspapers/mechanical papers recovery, there was very little documentation on the recovery of other nondurable paper by individual products. Industry-provided, nondurable goods-recovered paper estimates are presented as a total for books, magazines, office-type papers, standard mail and other commercial printing. Total recovery (excluding newspapers/mechanical papers) was about 8.8 million tons, or 43.1 percent of nondurable goods paper generation in 2018.
Information on specific types of nondurable, paper and paperboard products can be found in the subsections below or in Tables 5 and 18 through 21 of the 2018 Data Tables.
- Newspapers/Mechanical Papers
- Books
- Magazines
- Office-Type Papers
- Marketing Mail
- Tissue Paper and Towels
- Paper Plates and Cups
- Other Non-Packaging Paper
- Other Commercial Printing
Newspapers/Mechanical Papers
Newspapers/mechanical papers are the largest single component of the paper products in the nondurable goods category, with 5.1 million tons generated in 2018 (1.7 percent of total MSW). EPA estimated that the amount of recycled newspapers/mechanical papers was 3.3 million tons in 2018. Since 2010, EPA expanded the category of “Newspapers” (including newsprint and groundwood* inserts) to include directories and other mechanical papers previously counted as the category of “Other Commercial Printing.”
*Groundwood papers, like newsprint, are made primarily from pulp prepared by a mechanical process. The nature of the pulp (groundwood versus chemical) affects the potential uses for recycled paper.
The data in the table below are from 1960 to 2018, relating to the total number of tons of newspapers/mechanical papers generated, recycled, composted, combusted with energy recovery and landfilled.
| Management Pathway | 1960 | 1970 | 1980 | 1990 | 2000 | 2005 | 2010 | 2015 | 2017 | 2018 |
|---|---|---|---|---|---|---|---|---|---|---|
| Generation | 7,110 | 9,510 | 11,050 | 13,430 | 14,790 | 12,790 | 9,880 | 6,730 | 5,440 | 5,050 |
| Recycled | 1,820 | 2,250 | 3,020 | 5,110 | 8,720 | 9,360 | 7,070 | 4,790 | 4,180 | 3,270 |
| Composted | - | - | - | - | - | - | - | - | - | - |
| Combustion with Energy Recovery | - | 30 | 160 | 1,420 | 1,180 | 620 | 500 | 380 | 250 | 350 |
| Landfilled | 5,290 | 7,230 | 7,870 | 6,900 | 4,890 | 2,810 | 2,310 | 1,560 | 1,010 | 1,430 |
Source: American Forest & Paper Association
A dash in the table means that data is not available.
Books
Books made of groundwood and chemical pulp amounted to approximately 690,000 tons, or 0.2 percent of total MSW generation in 2018. There is very little additional data available on books.
The data in the table below are from 1960 to 2018, relating to the total number of tons of books generated, recycled, composted, combusted with energy recovery and landfilled.
| Management Pathway | 1960 | 1970 | 1980 | 1990 | 2000 | 2005 | 2010 | 2015 | 2017 | 2018 |
|---|---|---|---|---|---|---|---|---|---|---|
| Generation | - | - | - | 970 | 1,240 | 1,100 | 990 | 800 | 700 | 690 |
| Recycled | - | - | - | 100 | 240 | 270 | - | - | - | - |
| Composted | - | - | - | - | - | - | - | - | - | - |
| Combusted with Energy Recovery | - | - | - | 150 | 190 | 150 | - | - | - | - |
| Landfilled | - | - | - | 720 | 810 | 680 | - | - | - | - |
Source: American Forest & Paper Association
A dash in the table means that data is not available.
*Note: Data for the waste management of books is only available from 1990-2005.
Magazines
Magazines are predominantly made of coated groundwood, but some uncoated groundwood and chemical pulps are also used. Magazines accounted for an estimated 980,000 tons, or 0.3 percent of total MSW generation in 2018. There is very little additional data available on magazines.
The data in the table below are from 1960 to 2018, relating to the total number of tons of magazines generated, recycled, composted, combusted with energy recovery and landfilled.
| Management Pathway | 1960 | 1970 | 1980 | 1990 | 2000 | 2005 | 2010 | 2015 | 2017 | 2018 |
|---|---|---|---|---|---|---|---|---|---|---|
| Generation | - | - | - | 2,830 | 2,230 | 2,580 | 1,590 | 1,190 | 1,020 | 980 |
| Recycled | - | - | - | 300 | 710 | 960 | - | - | - | - |
| Composted | - | - | - | - | - | - | - | - | - | - |
| Combustion with Energy Recovery | - | - | - | 430 | 290 | 290 | - | - | - | - |
| Landfilled | - | - | - | 2,100 | 1,230 | 1,330 | - | - | - | - |
Source: American Forest & Paper Association
A dash in the table means that data is not available.
*Note: Data for the waste management of standard mail is only available from 1990-2005.
Office-Type Papers
Offices generate many different kinds of papers. For this report, office-type paper estimates include high-grade papers such as copier paper, computer printout, and stationery. Generation of these office papers was about four million tons, or 1.4 percent of total MSW generation in 2018. These types of papers are almost entirely made of uncoated chemical pulp, although some amounts of groundwood are also used. Some locations, other than offices, generate these office-type papers, including homes and institutions such as schools, while EPA measures other kinds of papers (e.g., newspapers, magazines and packaging) that offices generate in other categories. There is very little additional data available on office-type papers.
The data in the table below are from 1960 to 2018, relating to the total number of tons of office-type paper generated, recycled, composted, combusted with energy recovery and landfilled.
| Management Pathway | 1960 | 1970 | 1980 | 1990 | 2000 | 2005 | 2010 | 2015 | 2017 | 2018 |
|---|---|---|---|---|---|---|---|---|---|---|
| Generation | 1,520 | 2,650 | 4,000 | 6,410 | 7,420 | 6,620 | 5,260 | 4,530 | 3,970 | 3,970 |
| Recycled | 250 | 710 | 870 | 1,700 | 4,090 | 4,110 | - | - | - | - |
| Composted | - | - | - | - | - | - | - | - | - | - |
| Combustion with Energy Recovery | - | 10 | 60 | 800 | 650 | 460 | - | - | - | - |
| Landfilled | 1,270 | 1,930 | 3,070 | 3,910 | 2,680 | 2,050 | - | - | - | - |
Source: American Forest & Paper Association
A dash in the table means that data is not available.
*Note: Data for the waste management of standard mail is only available from 1970-2005.
Marketing Mail
Marketing mail includes catalogs and other direct bulk mailings. These amounted to an estimated 3.7 million tons, or 1.3 percent of MSW generation, in 2018. Marketing mail includes paper made with both groundwood and chemical pulps.
The data in the table below are from 1960 to 2018, relating to the total number of tons of standard mail generated, recycled, composted, combusted with energy recovery and landfilled.
| Management Pathway | 1960 | 1970 | 1980 | 1990 | 2000 | 2005 | 2010 | 2015 | 2017 | 2018 |
|---|---|---|---|---|---|---|---|---|---|---|
| Generation | - | - | - | 3,820 | 5,570 | 5,830 | 4,340 | 4,050 | 3,790 | 3,670 |
| Recycled | - | - | - | 200 | 1,830 | 2,090 | - | - | - | - |
| Composted | - | - | - | - | - | - | - | - | - | - |
| Combustion with Energy Recovery | - | - | - | 620 | 730 | 680 | - | - | - | - |
| Landfilled | - | - | - | 3,000 | 3,010 | 3,060 | - | - | - | - |
Source: American Forest & Paper Association
A dash in the table means that data is not available.
Tissue Paper and Towels
The generation of tissue paper and towels includes facial and sanitary tissues and table napkins, but not bathroom tissue, which goes directly into the wastewater treatment system. Other examples include decorative and laminated tissue papers and crepe papers. Homes, restaurants, other commercial establishments and institutions such as hospitals use tissue papers. Tissue paper and towels (not including bathroom tissue) amounted to 3.8 million tons (1.3 percent of total MSW generation) in 2018. EPA did not identify any significant recovery of tissue products for recycling, although some composting of these items exists. There is very little additional data available for tissue papers and towels.
The data in the table below are from 1960 to 2018, relating to the total number of tons of tissue paper and towels generated, recycled, composted, combusted with energy recovery and landfilled.
| Management Pathway | 1960 | 1970 | 1980 | 1990 | 2000 | 2005 | 2010 | 2015 | 2017 | 2018 |
|---|---|---|---|---|---|---|---|---|---|---|
| Generation | 1,090 | 2,080 | 2,300 | 2,960 | 3,220 | 3,460 | 3,490 | 3,680 | 3,750 | 3,790 |
| Recycled | - | - | - | - | - | - | - | - | - | - |
| Composted | - | - | - | - | - | - | - | - | - | - |
| Combustion for Energy Recovery | - | 10 | 50 | 500 | 620 | 630 | - | - | - | - |
| Landfilled | 1,090 | 2,070 | 2,250 | 2,460 | 2,600 | 2,830 | - | - | - | - |
Source: American Forest & Paper Association
A dash in the table means that data is not available.
*Note: Data for the waste management of tissue paper and paper towels is only available from 1960-2005.
Paper Plates and Cups
Paper plates and cups include paper plates, cups, bowls and other food service products used in homes, in commercial establishments like restaurants, as well as in institutional settings such as schools. EPA estimated that the generation of these products was 1.4 million tons (0.5 percent of total MSW generation) in 2018. EPA did not identify any significant recovery for recycling of these products, although there is some composting of these items.
The data in the table below are from 1960 to 2018, relating to the total number of tons of paper plates and cups generated, recycled, composted, combusted with energy recovery and landfilled.
| Management Pathway | 1960 | 1970 | 1980 | 1990 | 2000 | 2005 | 2010 | 2015 | 2017 | 2018 |
|---|---|---|---|---|---|---|---|---|---|---|
| Generation | 270 | 420 | 630 | 650 | 960 | 1,160 | 1,350 | 1,360 | 1,440 | 1,420 |
| Recycled | - | - | - | - | - | - | - | - | - | - |
| Composted | - | - | - | - | - | - | - | - | - | - |
| Combustion with Energy Recovery | - | - | 10 | 110 | 190 | 210 | - | - | - | - |
| Landfilled | 270 | 420 | 620 | 540 | 770 | 950 | - | - | - | - |
Source: American Forest & Paper Association
A dash in the table means that data is not available.
Other Non-Packaging Paper
Other non-packaging papers—including posters, photographic papers, cards and games—accounted for 3.9 million tons (1.3 percent of total MSW generation) in 2018. EPA did not identify any significant recycling of these papers.
The data in the table below are from 1960 to 2018, relating to the total number of tons of other non-packaging paper generated, recycled, composted, combusted with energy recovery and landfilled.
| Management Pathway | 1960 | 1970 | 1980 | 1990 | 2000 | 2005 | 2010 | 2015 | 2017 | 2018 |
|---|---|---|---|---|---|---|---|---|---|---|
| Generation | 2,700 | 3,630 | 4,230 | 3,840 | 4,250 | 4,490 | 4,190 | 3,700 | 3,880 | 3,920 |
| Recycled | 40 | 110 | - | - | - | - | - | - | - | - |
| Composted | - | - | - | - | - | - | - | - | - | - |
| Combustion with Energy Recovery | - | 10 | 80 | 650 | 820 | 820 | - | - | - | - |
| Landfilled | 2,660 | 3,510 | 4,150 | 3,190 | 3,430 | 3,670 | - | - | - | - |
Source: American Forest & Paper Association
A dash in the table means that data is not available.
Other Commercial Printing
Other commercial printing includes a wide range of paper items, including brochures, reports, menus and invitations. Both groundwood and chemical pulps can be found in these varied items. Generation was two million tons, or 0.7 percent of MSW generation in 2018.
The data in the table below are from 1960 to 2018, relating to the total number of tons of other commercial printing generated, recycled, composted, combusted with energy recovery and landfilled.
| Management Pathway | 1960 | 1970 | 1980 | 1990 | 2000 | 2005 | 2010 | 2015 | 2017 | 2018 |
|---|---|---|---|---|---|---|---|---|---|---|
| Generation | 1,260 | 2,130 | 3,120 | 4,460 | 7,380 | 6,440 | 2,480 | 2,080 | 1,960 | 2,000 |
| Recycled | 130 | 340 | 350 | 700 | 810 | 1,440 | - | - | - | - |
| Composted | - | - | - | - | - | - | - | - | - | - |
| Combustion with Energy Recovery | - | 10 | 60 | 640 | 1,270 | 910 | - | - | - | - |
| Landfilled | 1,130 | 1,780 | 2,710 | 3,120 | 5,300 | 4,090 | - | - | - | - |
Source: American Forest & Paper Association
A dash in the table means that data is not available.
*Note: Data for the waste management of other commercial printing paper is only available from 1960-2005.
Plastic Plates and Cups
This category includes plastic plates, cups, glasses, dishes and bowls, hinged containers, and other containers used in food service at home, in restaurants and other commercial establishments, and in institutional settings such as schools. These items were primarily composed of polystyrene resin. Out of total MSW generation in 2018, these products comprised an estimated one million tons, or 0.4 percent of all MSW. EPA did not identify any significant recycling in 2018. See Table 18 in the 2018 Data Tables for more in-depth information.
The data in the table below are from 1960 to 2018, relating to the total number of tons of plastic plates and cups generated, recycled, composted, combusted with energy recovery and landfilled.
| Management Pathway | 1960 | 1970 | 1980 | 1990 | 2000 | 2005 | 2010 | 2015 | 2017 | 2018 |
|---|---|---|---|---|---|---|---|---|---|---|
| Generation | - | - | 190 | 650 | 870 | 930 | 890 | 1,050 | 1,080 | 1,030 |
| Recycled | - | - | - | - | - | - | - | - | - | - |
| Composted | - | - | - | - | - | - | - | - | - | - |
| Combustion with Energy Recovery | - | - | - | 110 | 170 | 170 | 160 | 210 | 210 | 200 |
| Landfilled | - | - | 190 | 540 | 700 | 760 | 730 | 840 | 870 | 830 |
Source: American Chemistry Council
A dash in the table means that data is not available.
Trash Bags
This category includes plastic trash bags made of high-density polyethylene and low-density polyethylene for both indoor and outdoor use. Out of total MSW generation in 2018, generation of plastic trash bags amounts to about 1.2 million tons, or 0.4 percent. EPA did not identify any significant recycling in 2018.
The data in the table below are from 1960 to 2018, relating to the total number of tons of trash bags generated, recycled, composted, combusted with energy recovery and landfilled.
| Management Pathway | 1960 | 1970 | 1980 | 1990 | 2000 | 2005 | 2010 | 2015 | 2017 | 2018 |
|---|---|---|---|---|---|---|---|---|---|---|
| Generation | - | - | - | 780 | 850 | 1,060 | 980 | 1,130 | 1,140 | 1,230 |
| Recycled | - | - | - | - | - | - | - | - | - | - |
| Composted | - | - | - | - | - | - | - | - | - | - |
| Combustion with Energy Recovery | - | - | - | 130 | 160 | 190 | 170 | 220 | 220 | 240 |
| Landfilled | - | - | - | 650 | 690 | 870 | 810 | 910 | 920 | 990 |
Source: American Chemistry Council
A dash in the table means that data is not available.
Disposable Diapers
This category includes estimates of both infant diapers and adult incontinence products. EPA estimated generation using data on sales of the products along with information on average weights and composition. The estimated generation of disposable diapers in 2018 was 4.1 million tons, which was 1.4 percent of total MSW generation that year. (This tonnage includes an adjustment for the urine and feces contained within the discarded diapers). The materials portion of the diapers includes wood pulp, plastics (including the super-absorbent materials now present in most diapers), and tissue paper. EPA did not identify any significant recycling or composting of disposable diapers in 2018.
The data in the table below are from 1960 to 2018, relating to the total number of tons of disposable diapers generated, recycled, composted, combusted with energy recovery and landfilled.
| Management Pathway | 1960 | 1970 | 1980 | 1990 | 2000 | 2005 | 2010 | 2015 | 2017 | 2018 |
|---|---|---|---|---|---|---|---|---|---|---|
| Generation | - | 350 | 1,930 | 2,700 | 3,230 | 3,410 | 3,700 | 4,170 | 4,150 | 4,100 |
| Recycled | - | - | - | - | - | - | - | - | - | - |
| Composted | - | - | - | - | - | - | - | - | - | - |
| Combustion with Energy Recovery | - | - | 30 | 460 | 630 | 620 | 650 | 810 | 810 | 800 |
| Landfilled | - | 350 | 1,900 | 2,240 | 2,600 | 2,790 | 3,050 | 3,360 | 3,340 | 3,300 |
Source: EDANA (2015) Sustainability Report, 4th Edition.
A dash in the table means that data is not available.
Clothing and Footwear
EPA estimates that the generation of clothing and footwear was 13 million tons in 2018 (4.4 percent of total MSW). Textiles, rubber and leather are the major material components of this category, with some plastics present as well. Using information from the U.S. Department of Commerce's Office of Textiles and Apparel, along with the Council for Textile Recycling, EPA estimated that the amount of clothing and footwear recycled in 2018 was 1.7 million tons (13.0 percent recycling rate). (Reuse occurs before generation and is not included in the generation or recycling estimates).
The data in the table below are from 1960 to 2018, relating to the total number of tons of clothing and footwear generated, recycled, composted, combusted with energy recovery and landfilled.
| Management Pathway | 1960 | 1970 | 1980 | 1990 | 2000 | 2005 | 2010 | 2015 | 2017 | 2018 |
|---|---|---|---|---|---|---|---|---|---|---|
| Generation | 1,360 | 1,620 | 2,170 | 4,010 | 6,470 | 7,890 | 9,100 | 11,940 | 12,800 | 12,970 |
| Recycled | 50 | 60 | 150 | 520 | 900 | 1,250 | 1,250 | 1,690 | 1,740 | 1,690 |
| Composted | - | - | - | - | - | - | - | - | ||
| Combustion with Energy Recovery | - | 10 | 50 | 590 | 1,080 | 1,210 | 1,390 | 2,010 | 2,160 | 2,210 |
| Landfilled | 1,310 | 1,550 | 1,970 | 2,900 | 4,490 | 5,430 | 6,460 | 8,240 | 8,900 | 9,070 |
Sources: American Apparel & Footwear Association, American Textile Recycling Service (ATRS) and International Trade Commission.
A dash in the table means that data is not available.
Towels, Sheets and Pillowcases
EPA estimated that 1.5 million tons of towels, sheets and pillowcases were generated in 2018, using a methodology similar to that for clothing. The export or recycling of these textiles amounted to 240,000 tons in 2018 (15.8 percent recycling rate).
The data in the table below are from 1960 to 2018, relating to the total number of tons of towels, sheets and pillowcases generated, recycled, composted, combusted with energy recovery and landfilled.
| Management Pathway | 1960 | 1970 | 1980 | 1990 | 2000 | 2005 | 2010 | 2015 | 2017 | 2018 |
|---|---|---|---|---|---|---|---|---|---|---|
| Generation | - | - | - | 710 | 820 | 980 | 1,290 | 1,350 | 1,470 | 1,520 |
| Recycled | - | - | - | 120 | 140 | 170 | 220 | 220 | 240 | 240 |
| Composted | - | - | - | - | - | - | - | - | - | - |
| Combustion with Energy Recovery | - | - | - | 100 | 130 | 150 | 190 | 220 | 240 | 250 |
| Landfilled | - | - | - | 490 | 550 | 660 | 880 | 910 | 990 | 1,030 |
A dash in the table means that data is not available.
Other Miscellaneous Nondurable Goods
Generation of other miscellaneous nondurable goods was 4.1 million tons, or 1.4 percent, of total MSW in 2018. The primary material component of miscellaneous nondurables is plastics, although some aluminum, rubber and textiles are also present. Typical products in miscellaneous nondurable goods include items such as shower curtains and other household items, disposable medical supplies, and novelty items.
Each year, the American Chemistry Council publishes information taken from resin sales data on the generation of plastic products in miscellaneous nondurables. EPA based its estimates of the generation of other materials in these nondurable products on information provided in past reports in EPA’s Facts and Figures series.
In 2018, about 4.1 million tons of other miscellaneous nondurable goods waste was produced. Of this total, about 4.4 percent was recycled, while 18.5 percent was combusted with energy recovery and 77.1 percent was sent to landfills.
The data in the table below are from 1960 to 2018, relating to the total number of tons of other miscellaneous nondurable goods generated, recycled, composted, combusted with energy recovery and landfilled.
| Management Pathway | 1960 | 1970 | 1980 | 1990 | 2000 | 2005 | 2010 | 2015 | 2017 | 2018 |
|---|---|---|---|---|---|---|---|---|---|---|
| Generation | 100 | 200 | 1,410 | 3,340 | 4,030 | 4,250 | 3,720 | 4,050 | 4,110 | 4,100 |
| Recycled | - | - | - | - | - | - | - | 160 | 220 | 180 |
| Composted | - | - | - | - | - | - | - | - | - | - |
| Combustion with Energy Recovery | - | - | 20 | 570 | 780 | 770 | 660 | 750 | 750 | 760 |
| Landfilled | 100 | 200 | 1,390 | 2,770 | 3,250 | 3,480 | 3,060 | 3,140 | 3,140 | 3,160 |
A dash in the table means that data is not available.