EPA-FDA Fish Advice: Technical Information
This webpage contains detailed information on the underlying calculations for the fish advice for women of childbearing age (about 16-49 years old), pregnant and breastfeeding women, and parents and caregivers of young children. It contains the following information:
- How the chart for FDA’s and EPA’s fish advice was derived.
- Sortable table of fish species that contains data used in separating the fish into categories, such as mercury concentrations and the number of weekly servings.
- Recommended portion sizes for children based on age.
How FDA and EPA derived the categories in the fish chart
The agencies decided which category each fish belonged to by calculating the highest average amount of mercury that could be in a fish when eaten one, two, and three times a week without going over the maximum acceptable mercury intake amount for an average pregnant woman. The agencies determined the maximum acceptable intake amount by comparing the reference dose (RfD) developed by EPA to the predicted exposure from the consumption of different fish species. An RfD is determined to be a rate of exposure that a person can experience over a lifetime without appreciable risk of harm; however, the RfD for mercury is protective of neurodevelopmental effects from a critical window of development for a fetus during pregnancy. The RfD includes a 10-fold uncertainty factor to allow for variability among individuals and groups, including individuals who are not pregnant. By expressing the advice in terms of recommendations for weekly intake of fish based on the RfD, the agencies aim to help consumers reduce exposure to mercury, while also enabling them to achieve the health benefits from eating fish. We describe the equations and results for determining which fish we placed in each category.
Equations for determining which category each fish went in
The boundaries for each category (or screening values) were calculated using equation 5-4 from EPA’s Guidance for Assessing Chemical Contaminant Data for Use in Fish Advisories, Volume 1: Fish Sampling and Analysis Third Edition (November 2000).
![]()
For this fish advice, we used the screening value as the highest average amount of mercury in fish that would not exceed the reference dose at a given consumption rate. The consumption rate (CR) was calculated using the following equation:
![]()
Factors used in the calculations
Reference dose for chronic oral exposure to methylmercury = 0.1 µg mercury / kg body weight / day. Taken from EPA's Integrated Risk Information System (IRIS).
Body weight = 75 kilograms (165 pounds) = average weight of a pregnant woman. Taken from Table 8-29 of EPA’s Exposure Factors Handbook: 2011 Edition. This weight is supported by 2003-2010 NHANES data (2-day dietary recall) for pregnant women of 78 kg and coincides with average female adult body weight of 166 pounds from CDC's Anthropometric Reference Data for Children and Adults: United States, 2007–2010 (PDF) (48 pp, 1 MB, About PDF)(Oct 2012).
Serving size = 4 ounces (113 grams) before cooking based on the FDA reference amounts customarily consumed per eating occasion (RACC) for fish and shellfish without sauce in 21 CFR 101.12[1]. The RACC for this category of food is 85 g for cooked fish and 110 g for raw fish. RACCs are used as the basis for nutrient declarations on Nutrition Facts labels on food packages.
Serving size is also consistent with the recommendation of 8-12 ounces of a variety of seafood per week from choices lower in methyl mercury found in the Dietary Guidelines for Americans 2015 and USDA’s. This is equivalent to 2-3 four-ounce servings per week.
Weekly servings = 1, 2, or 3
Screening Values for Fish Categories
| Weekly fish servings | Screening value (µg/g) | Chart category |
|---|---|---|
| 0 | > 0.46 | Choices to Avoid |
| 1 | ≤ 0.46 | Good Choices |
| 2 | ≤ 0.23 | |
| 3 | ≤ 0.15 | Best Choices |
The screening value is the highest allowable average amount of mercury in fish at a given consumption rate. Therefore:
Highest allowable average mercury concentration in fish per serving when eating 3 servings per week = 0.15 µg/g. Any fish with an average mercury concentration less than or equal to 0.15 µg/g was placed in the “best choices – eat 2-3 servings a week” category.
Highest allowable average mercury concentration in fish per serving when eating 2 servings per week = 0.23 µg/g. In order to be protective, any fish with an average mercury concentration greater than 0.15 µg/g up to 0.23 µg/g was placed in the “good choices – eat 1 serving a week” category because it could not be eaten 3 times a week without exceeding the reference dose.
Highest allowable average mercury concentration in fish per serving when eating 1 serving per week = 0.46 µg/g. Any fish with an average mercury concentration greater than 0.23 µg/g up to 0.46 µg/g was placed in the “good choices – eat 1 serving a week” category. Any fish with an average mercury concentration greater than 0.46 µg/g was placed in the “choices to avoid” category.
Sortable table of fish species, fish data, and weekly servings
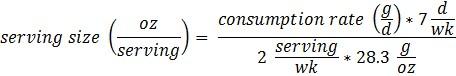
The table can be sorted by column. We primarily used fish data from FDA’s monitoring database of mercury levels in commercial fish and shellfish (found at Mercury Levels in Commercial Fish and Shellfish (1990-2012) and Mercury Concentrations in Fish: FDA Monitoring Program (1990-2010)) with support from other sources referenced. All values for mercury are for fish before cooking except for those cooked during processing (e.g., canned fish). However, please remember that the fish advice recommends the consumption of only cooked fish for pregnant women; pregnant women should avoid eating raw fish. For those who are interested, mercury concentrations for cooked fish can be roughly approximated using the following formula: (μg mercury/ g uncooked fish) × (1 g uncooked fish/ 0.75 g cooked fish) × (28.3 g/ 1 oz)
For any fish species that had fewer than 30 samples in FDA’s dataset, we examined the following datasets: Karimi et al. (2012), EPA’s Mercury in Marine Life Database, EPA National Coastal Assessment (NCA): NCA/ National Coastal Condition Assessment (NCCA) data, Health Canada (2007), and a USDA-funded study by Cladis et al. 2014. We calculated the 95th percent confidence intervals on the mean for all fish species with available data based on a boot strap analysis using the statistical software ‘R’ (library boot). We then considered whether the upper 95th percent confidence interval exceeded the screening value for that category. If the concentration for the 95th percent upper confidence interval fell in a different category, we looked at the means and sample sizes for that fish in those other datasets. If this supplemental data indicated a fish should change categories, then we moved it. If the supplemental data indicated a fish should remain in its calculated category, then we did not move it. If there were no supplemental data or if the sample sizes of that supplemental data were small, then we moved the fish based on the 95th percent upper confidence interval concentration. If the concentration for the 95th percent upper confidence interval did not fall in a different category but the supplemental data indicated a fish should change categories, then we moved it.
| Fish species | Mercury concentration, average (µg/g or ppm) | Mercury concentration, 95% confidence interval (µg/g or ppm) | Number of samples | Fish category |
|---|---|---|---|---|
| Anchovy | 0.02 | 0.01, 0.02 | 15 | Best choice |
| Atlantic croaker | 0.07 | 0.06, 0.08 | 90 | Best choice |
| Atlantic mackerel | 0.05 | NC | 80 | Best choice |
| Black sea bass | 0.13 | 0.10, 0.16 | 29 | Best choice |
| Bluefish | 0.37 | 0.33, 0.42 | 94 | Good choice |
| Buffalofish | 0.14 | 0.10, 0.19 | 17 | Good choice |
| Butterfish | 0.06 | NC | 89 | Best choice |
| Carp | 0.11 | 0.06, 0.16 | 14 | Good choice |
| Catfish | 0.02 | 0.01, 0.04 | 59 | Best choice |
| Chilean sea bass/Patagonian toothfish | 0.35 | 0.29, 0.43 | 74 | Good choice |
| Clam | 0.01 | 0.00, 0.01 | 15 | Best choice |
| Cod | 0.11 | 0.09, 0.14 | 115 | Best choice |
| Crab | 0.06 | 0.05, 0.09 | 93 | Best choice |
| Crawfish | 0.03 | 0.03, 0.04 | 46 | Best choice |
| Flatfish (flounder, plaice, sole) | 0.06 | 0.04, 0.07 | 71 | Best choice |
| Grouper | 0.45 | 0.38, 0.52 | 53 | Good choice |
| Haddock | 0.06 | 0.05, 0.06 | 50 | Best choice |
| Hake | 0.08 | 0.06, 0.10 | 49 | Best choice |
| Halibut | 0.24 | 0.20, 0.29 | 101 | Good choice |
| Herring | 0.08 | 0.04, 0.13 | 27 | Best choice |
| King mackerel | 0.73 | NC | 213 | Avoid |
| Lobster | 0.10 | 0.06, 0.14 | 22 | Best choice |
| Mahi mahi / dolphinfish | 0.18 | 0.14, 0.22 | 29 | Good choice |
| Marlin | 0.49 | 0.38, 0.60 | 16 | Avoid |
| Monkfish | 0.16 | 0.11, 0.21 | 11 | Good choice |
| Mullet | 0.05 | 0.02, 0.09 | 20 | Best choice |
| Orange roughy | 0.57 | 0.53, 0.61 | 81 | Avoid |
| Oyster | 0.01 | 0.00, 0.02 | 61 | Best choice |
| Pacific chub mackerel | 0.09 | NC | 30 | Best choice |
| Perch, freshwater | 0.15 | 0.10, 0.20 | 19 | Best choice |
| Perch, ocean | 0.12 | 0.08, 0.17 | 31 | Best choice |
| Pickerel | 0.09 | 0.05, 0.14 | 16 | Best choice |
| Pollock | 0.03 | 0.02, 0.05 | 95 | Best choice |
| Rockfish | 0.23 | 0.17, 0.30 | 19 | Good choice |
| Sablefish | 0.36 | 0.28, 0.45 | 26 | Good choice |
| Salmon, canned | 0.01 | 0.005, 0.02 | 19 | Best choice |
| Salmon, fresh/frozen | 0.02 | 0.02, 0.03 | 94 | Best choice |
| Sardine | 0.01 | 0.01, 0.02 | 90 | Best choice |
| Scallop | <0.01 | 0.00, 0.01 | 39 | Best choice |
| Shad | 0.04 | 0.02, 0.06 | 15 | Best choice |
| Shark | 0.98 | 0.91, 1.05 | 356 | Avoid |
| Sheepshead | 0.09 | 0.06, 0.12 | 8 | Good choice |
| Shrimp | 0.01 | 0.01, 0.01 | 40 | Best choice |
| Skate | 0.14 | NC | 56 | Best choice |
| Smelt | 0.08 | 0.05, 0.13 | 23 | Best choice |
| Snapper | 0.17 | 0.12, 0.23 | 67 | Good choice |
| Spanish mackerel | 0.35 | NC | 109 | Good choice |
| Squid | 0.02 | 0.02, 0.03 | 36 | Best choice |
| Striped bass (ocean) | 0.07 | 0.04, 0.11 | 41 | Good choice |
| Swordfish | 1.00 | 0.95, 1.04 | 636 | Avoid |
| Tilapia | 0.01 | 0.01, 0.02 | 32 | Best choice |
| Tilefish (from Gulf of Mexico) | 1.45 | NC | 60 | Avoid |
| Tilefish (from Atlantic Ocean) | 0.14 | 0.11, 0.19 | 32 | Good choice |
| Trout, freshwater | 0.07 | 0.03, 0.12 | 35 | Best choice |
| Tuna, albacore / white tuna, canned | 0.35 | 0.34, 0.36 | 451 | Good choice |
| Tuna, albacore / white tuna, fresh/frozen | 0.36 | 0.32, 0.40 | 43 | Good choice |
| Tuna, bigeye | 0.69 | 0.56, 0.84 | 21 | Avoid |
| Tuna, light, canned (includes skipjack) | 0.13 | 0.12, 0.14 | 548 | Best choice |
| Tuna, yellowfin | 0.35 | 0.33, 0.39 | 231 | Good choice |
| Weakfish/sea trout | 0.23 | 0.18, 0.30 | 46 | Good choice |
| White croaker/Pacific croaker | 0.29 | 0.25, 0.32 | 15 | Good choice |
| Whitefish | 0.09 | 0.06, 0.12 | 37 | Best choice |
| Whiting | 0.05 | 0.03, 0.07 | 13 | Best choice |
NC = not calculated
Recommended serving sizes for children based on age
We recommend serving fish to children 1-2 times a week, but the serving sizes should be smaller than adult portions and right for your child’s age and physical activity level. This chart shows the weekly amount of fish (in ounces per week) that children should eat based on either caloric need or to keep the fish consumption below the maximum acceptable mercury intake (RfD) based on fish in the “best choices” category. The calorie need range is based on males and females combined, based on USDA-recommended consumption amounts and USDA-recommended calorie levels at different ages.[2] The mercury RfD range of intakes is based on the average body weight of females in each age range to be more protective because girls generally weigh less than boys.
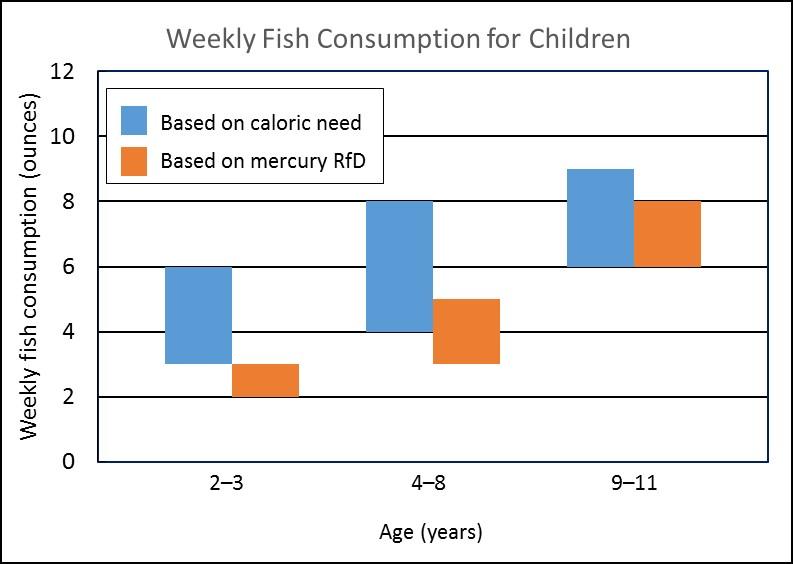
Recommended weekly fish consumption based on caloric need varies depending on a child’s age and physical activity level. Source: 2015 Dietary Guidelines. See footnote 2 for more details. Recommended weekly fish consumption based on the mercury RfD varies depending on a child’s body weight, where female body weights were used to be more health protective. For children less than two years of age, the American Academy of Pediatrics includes fish in the list of protein foods that are appropriate for toddlers 1-3 years of age, and states that the average toddler eats two 1-ounce servings of protein foods per day. However, the American Academy of Pediatrics does not recommend a specific fish consumption amount for toddlers in this age range.
Equations for determining children’s serving sizes based on the mercury reference dose
The maximum allowable fish consumption rate was calculated using equation 3-3 from EPA’s Guidance for Assessing Chemical Contaminant Data for Use in Fish Advisories, Volume 2: Risk Assessment and Fish Consumption Limits Third Edition (PDF) (383 pp, 2 MB, About PDF) (November 2000).
![]()
Factors used in the equations
RfD = reference dose for chronic oral exposure to methylmercury = 0.1 µg mercury/kg body weight/day. Taken from EPA’s Integrated Risk Information System (IRIS).
BW = average body weight for girls (kg) from CDC's Anthropometric Reference Data for Children and Adults: United States, 2007–2010 (Oct 2012) - Table 1 (PDF) (48 pp, 1 MB, About PDF), based on data from National Health and Nutrition Examination Surveys (NHANES)
Cm = highest average concentration of mercury in fish in “Best Choices” group = 0.15 µg/g
The results were converted from a daily fish consumption rate in grams per day to a serving size in ounces per serving using the following equation and a weekly serving rate of 2 servings per week:
Results - Child’s serving size if eating 2 servings per week from “best choices,” when serving size is based on mercury intake
| Age (years) | Average female weight (kilograms) | Serving size* (ounces) for child eating 2 servings with 0.15 µg/g of mercury |
|---|---|---|
| 1** | 10.9 | 0.9 |
| 2 | 13.4 | 1.1 |
| 3 | 15.7 | 1.3 |
| 4 | 17.7 | 1.5 |
| 5 | 21.1 | 1.7 |
| 6 | 23.6 | 1.9 |
| 7 | 26.8 | 2.2 |
| 8 | 31.9 | 2.6 |
| 9 | 35.5 | 2.9 |
| 10 | 41.1 | 3.4 |
| 11 | 47.5 | 3.9 |
* To calculate weekly amount of “Best Choices,” multiply serving size in this column by 2.
** Added December 9, 2020 as a technical reference for use and development of the 2020-2025 Dietary Guidelines for Americans, which will include dietary recommendations for children under 2 years of age. After the 2020-2025 Dietary Guidelines are released, FDA and EPA will review the EPA-FDA Advice about Eating Fish and Shellfish to determine if updates are needed.
-
Age 2: 1 ounce per serving
-
Age 6: 2 ounces per serving
-
Age 9: 3 ounces per serving
-
Age 11 and up: 4 ounces per serving
References
Cladis, D.P., Kleiner, A.C., and Santerre, C.R. (2014). Mercury content in commercially available finfish in the United States. J Food Prot 77, 1361-1366. FDA/EPA obtained the raw data from the study authors for analysis.
Health Canada. (2007) Human Health Risk Assessment of Mercury in Fish and Health Benefits of Fish Consumption, Bureau of Chemical Safety Food Directorate Health Products and Food Branch, Ottawa, Ontario, Canada
Karimi, R., Fitzgerald, T.P., and Fisher, N.S. (2012). A quantitative synthesis of mercury in commercial seafood and implications for exposure in the United States. Environ Health Perspect 120, 1512-1519.
U.S. Environmental Protection Agency (U.S. EPA). (2016), National Coastal Condition Assessment (NCCA) Office of Water & Office of Research and Development, EPA 841-R-15-006, Washington, D.C. 2010 Results.
U.S. Environmental Protection Agency. (U.S.EPA) (2016). National Coastal Assessment (NCA): Northeast 2000-2006 Summary Data.
U.S. Environmental Protection Agency (U.S.EPA) 2003. Mercury in Marine Life Database. Office of Wetlands, Oceans and Watersheds.
[1] The RACC we used was for entrees without sauce, e.g., plain or fried fish and shellfish, fish and shellfish cake.
[2] Dietary Guidelines estimate that calorie needs depend on children’s age, whether children are “sedentary,” “moderately active” or “active,” and whether they are male or female. Dietary Guidelines also recommend children consume specified amounts of seafood per week (in ounces per week) based on their calorie needs. In developing this chart, FDA and EPA considered the calorie need ranges that the Dietary Guidelines estimate for each age group and the amount of seafood consumption that the Dietary Guidelines recommend at different calorie levels. For example, for children ages 4 to 8 years, the Dietary Guidelines estimate that to maintain calorie balance females need between 1200 and 1800 calories per day and males need between 1200 and 2000 calories per day, depending on whether they are sedentary or physically active. For individuals with a calorie level of 1,200 per day, Dietary Guidelines recommend consumption of 4 ounces of seafood per week. For individuals with a calorie level of 2,000 per day, Dietary Guidelines recommend 8 ounces of seafood consumption per week. Therefore, the recommended fish consumption per week for the 4-8 year-old age group ranges from 4 oz per week (based on 1200 calories for sedentary females) to 8 oz per week (based on 2000 calories for active males).