Plug-in Hybrid Electric Vehicle - Learn More About the New Label
Try the interactive version of the label

This label was created at the time of the rulemaking. The assumptions and ratings do not reflect a particular model year.
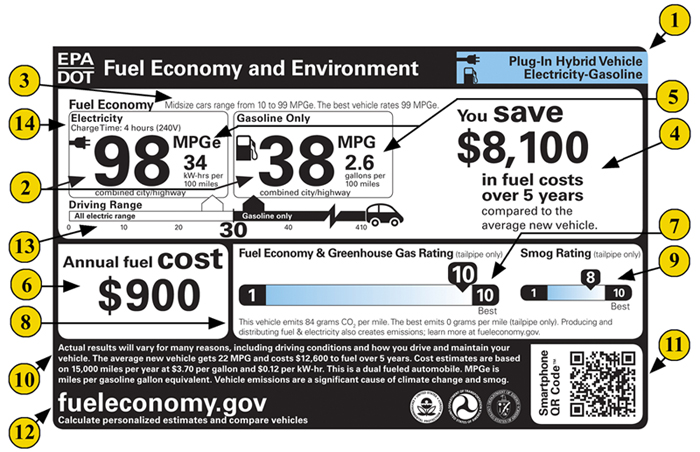
The upper right corner of the label displays text and a related icon to identify it as a plug-in hybrid electric vehicle. You will see different text and icons on the labels for other vehicles. Note that hybrid gasoline-electric vehicles that do not have plug-in capability are identified as gasoline vehicles since they only use gasoline.
The label for plug-in hybrid electric vehicles displays fuel economy for both modes of operation.
The left-hand fuel economy box on the label displays the fuel economy when operating on electricity. This is described in miles per gallon of gasoline-equivalent (MPGe). Think of this as being similar to MPG, but instead of presenting miles per gallon of the vehicle’s fuel type, it represents the number of miles the vehicle can go using a quantity of fuel with the same energy content as a gallon of gasoline.
The right-hand fuel economy box displays the fuel economy when the battery is emptied and the vehicle is using gasoline. This is described in miles per gallon (MPG).
Both of these values represent the combined city and highway value. Combined fuel economy is a weighted average of City and Highway MPG values that is calculated by weighting the City value by 55% and the Highway value by 45%. Some form of the miles per gallon metric has been on vehicle labels since 1977.
3. Comparing Fuel Economy to Other Vehicles
This text indicates the category of the vehicle (e.g., Small SUV, Station Wagon, Pickup Truck, etc.) and the best and worst fuel economy within that category for the given model year. There are nine car categories, six truck categories, and a “special purpose vehicle” category. This text also tells you the best combined fuel economy among all new vehicles.
For each model year, EPA publishes lists identifying the best and worst fuel economy performers in each category.
· Most and Least Efficient Vehicles by EPA Size Class
Note: for those vehicles that do not use liquid fuels--such as electric vehicles, plug-in hybrid electric vehicles operating on electricity, and compressed natural gas vehicles-- the labels display miles per gallon of gasoline-equivalent (MPGe). This allows a reasonable comparison between vehicles using different fuels. For example, you can use MPGe to compare a compressed natural gas (CNG) vehicle with a gasoline vehicle, even though CNG is not dispensed or burned in actual gallons.
4. You Save/Spend More over 5 Years Compared to Average Vehicle
The label shows the estimated fuel cost over a five-year period for the vehicle compared to the average new vehicle. If the vehicle would save the consumer money compared to the average vehicle, the label would state, “You save $x,xxx in fuel costs over 5 years compared to the average new vehicle.” If the vehicle would be more expensive to operate than the average vehicle, the label would state, “You spend $x,xxx more in fuel costs over 5 years compared to the average new vehicle.” These estimates are based on driving 15,000 miles per year, for five years, and the projected fuel price for the year, which changes annually, and is referenced in the fine print.
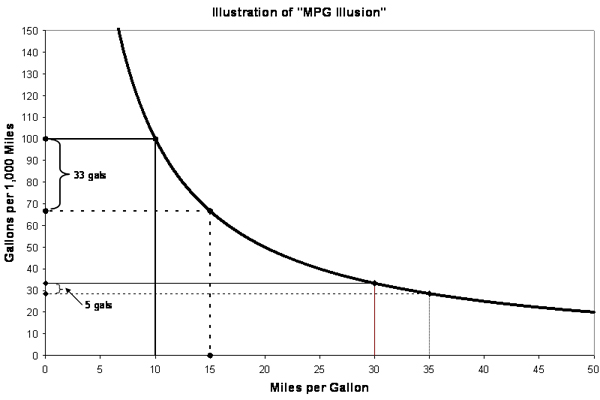
While a miles per gallon (MPG) estimate is a required feature that has appeared on the fuel economy label for several decades, this metric can be potentially misleading when consumers compare fuel economy improvements, particularly when they use it in place of fuel costs. The following chart shows the non-linear relationship between gallons used over a given distance and miles per gallon. The fuel savings, in gallons, for a vehicle that gets 10 MPG versus a vehicle that gets 15 MPG is about 33 gallons (assuming 1000 miles). On the other hand, the fuel savings in gallons, for the same 5 MPG fuel economy jump, for a 30 MPG versus a 35 MPG vehicle is only about 5 gallons.

This “MPG illusion” demonstrates why it may be more meaningful to express fuel efficiency in terms of consumption (e.g., gallons per mile or per 100 miles) rather than in terms of economy (miles per gallon). A fuel consumption metric allows for more accurate energy usage comparisons among vehicles.
The revised label includes both fuel economy and consumption information for all vehicle types.
The annual fuel cost is based on two assumptions: an annual mileage of 15,000 miles and a projected gasoline price. For more information on the source of projected fuel prices see “10. Details in Fine Print”.
7. Fuel Economy and Greenhouse Gas Rating
The label assigns each vehicle a rating from 1 (worst) to 10 (best) for fuel economy and greenhouse gas emissions (i.e., how much carbon dioxide the vehicle’s tailpipe emits each mile). Consumers may note that higher fuel economy is associated with a better GHG emissions profile.
There are two ratings that apply to each vehicle – one for fuel economy and one for greenhouse gas emissions – but gasoline vehicles will display only one rating. This is because carbon dioxide emissions are directly related to the amount of fuel consumed. This relationship varies from fuel to fuel, but both rating systems are based on gasoline vehicles, meaning that gasoline vehicles get the same rating for fuel economy and for greenhouse gas emissions.
This text provides three key pieces of information:
- Combined city/highway CO2 tailpipe emissions
The labeled vehicle’s CO2 tailpipe emissions are based on tested tailpipe CO2 emission rates. The rate of CO2 emissions is displayed in grams per mile. - Vehicle with lowest CO2 emissions
The label identifies the lowest tailpipe CO2 emissions of available vehicles. If there are electric or fuel cell vehicles on the market, which by definition have zero tailpipe emissions, this value will be zero grams per mile. - Learn more about emissions from the production of fuels at www.fueleconomy.gov
Driving your vehicle can yield both greenhouse gas (GHG) emissions from your vehicle's tailpipe and GHG emissions related to the production of the fuel used to power your vehicle. The Fuel Economy and Environment Label provides a Greenhouse Gas Rating, from 1 (worst) to 10 (best), based on your vehicle's tailpipe carbon dioxide emissions only. This rating does not reflect any GHG emissions associated with fuel production.
Note: You can estimate the total GHG emissions that would be associated with driving an electric vehicle or plug-in hybrid electric vehicle, including GHG emissions from the production of electricity used to power the vehicle, with our “Beyond Tailpipe Emissions” calculator tool.
This is a rating for vehicle tailpipe emissions of those pollutants that cause smog and other local air pollution. This information, listed as “Smog” on the labels, is displayed using a slider bar with a scale of 1 (worst) to 10 (best). The scale is based on the U.S. vehicle emissions standards, which incorporate specific thresholds for nitrogen oxide, non-methane organic gas, carbon monoxide, particulate matter, and formaldehyde. For those vehicles that run on electricity, the tailpipe emissions are zero.
This part of the label has a reminder that your fuel economy and emissions may be different due to a number of factors, such as how you drive and maintain your vehicle, how much you use air conditioning and other accessories, the weather, road conditions, how much the vehicle is loaded, and other factors.
This part of the label also details the assumptions that are used to determine the estimated annual fuel cost and the value used to compare 5-year costs to the average vehicle. EPA assumes annual mileage of 15,000 miles. The price of gasoline listed on new vehicle labels is based on projections from the U.S. Energy Information Administration for the applicable model year, and is updated annually.
When you are looking for a new vehicle at a dealership, you will be able to scan the QR Code® 1 (footnote) on the label using your smartphone, provided you have downloaded a scanner app. The QR Code® will link you to helpful tools and additional information about the vehicle. The same tools and information are available to everyone on www.fueleconomy.gov.
The label directs you to a website where you can compare vehicles and enter personalized information (e.g., local gas prices and individual driving habits) to get the best possible cost and energy-use estimates.
When the vehicle is fully charged, this value represents the approximate number of miles that can be travelled in combined city and highway driving before the vehicle must be recharged.
This indicates how long it takes to charge a fully empty battery using 240 volt electrical service. For the purposes of equivalent comparisons, all vehicles with external charging capability will display a charge time based on use of 240 volt service, unless the vehicle is not capable of receiving the higher voltage. Some owners may choose to install 240 volt service (in their garage, for example) and others may choose to use a 120 volt standard household outlet. Use of lower voltage than that specified on the label will result in longer charging times. The vehicle manufacturer should be able to provide complete information on charging times and the capabilities of their vehicles.
1 QR Code is registered trademark of DENSO WAVE INCORPORATED.
