Data and Major Findings
Data collected by the Coastal Wetland Monitoring Program (CWMP) can be used to determine the health of Great Lakes coastal wetlands and help managers make better-informed decisions. Each of the five taxonomic groups sampled and surveyed are summarized below.
| Species |
Number of Sites Where Taxa were Measured |
Average ± Standard Deviation Number of Species |
Minimum Number of Species |
Maximum Number of Species |
|---|---|---|---|---|
| Amphibians | 711 | 3 ± 1 | 1 | 7 |
| Birds | 727 | 20 ± 9 | 1 | 49 |
| Fish | 431 | 12 ± 5 | 2 | 28 |
| Macroinvertebrates | 474 | 41 ± 14 | 12 | 85 |
| Plants | 558 | 45 ± 17 | 1 | 100 |
Amphibians
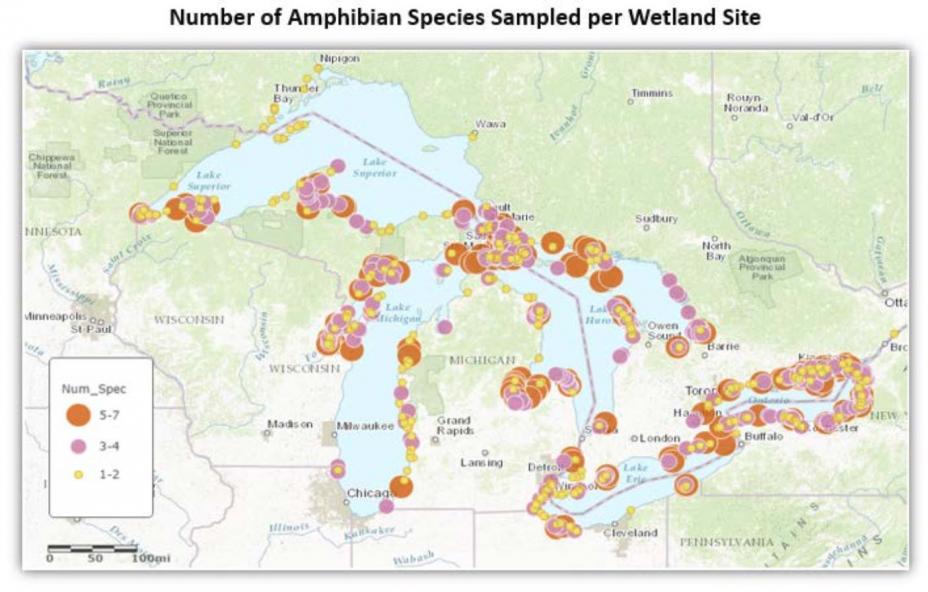
The spatial distribution of amphibian species surveyed from 2011 - 2015 across the Great Lakes basin is represented in the map below (Figure 1).
 View large version of this picture.
The map shows the distribution of amphibian species across the Great Lakes basin surveyed from 2011 - 2015 (Figure 1).
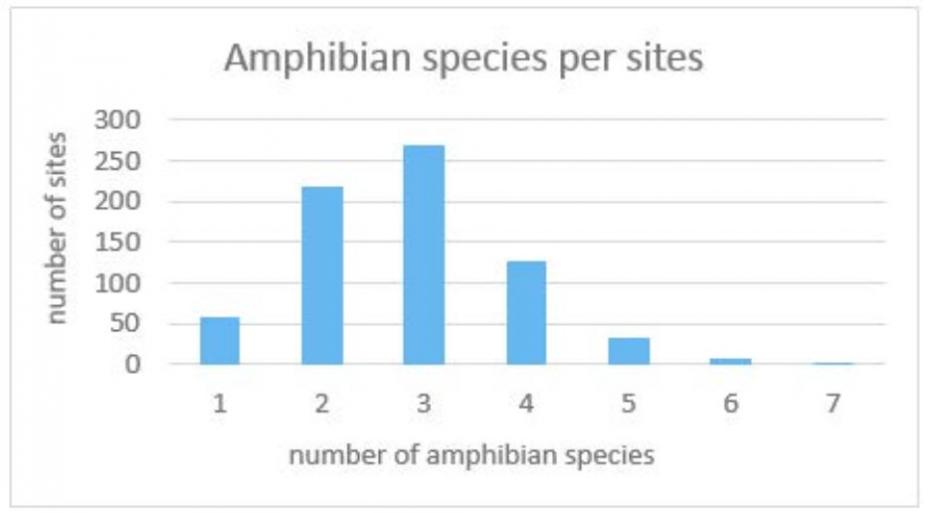
There were 711 coastal wetland sites sampled, 486 of those had either two or three amphibian species present (Figure 2).
 View large version of this picture.
This chart shows the number of amphibian species per wetland sites sampled
2011 - 2015 (Figure 2).
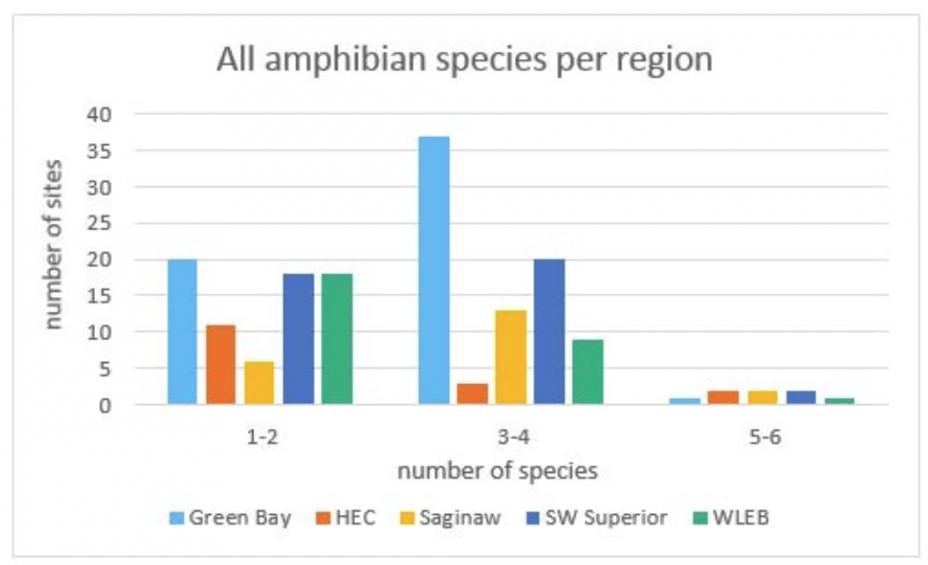
Figure 3 represents the results of wetland amphibian surveys from 2011 - 2015 for five geographic regions: Green Bay, the Lake Huron-Lake Erie corridor (HEC), Saginaw Bay, southwest Superior (SW Superior), and the western Lake Erie basin (WLEB). Amphibian data collected had no listed or invasive species present in any of the regions.
 View large version of this picture.
The bar graph shows the number of amphibian species 2011 - 2015 per region (Figure 3).
Birds
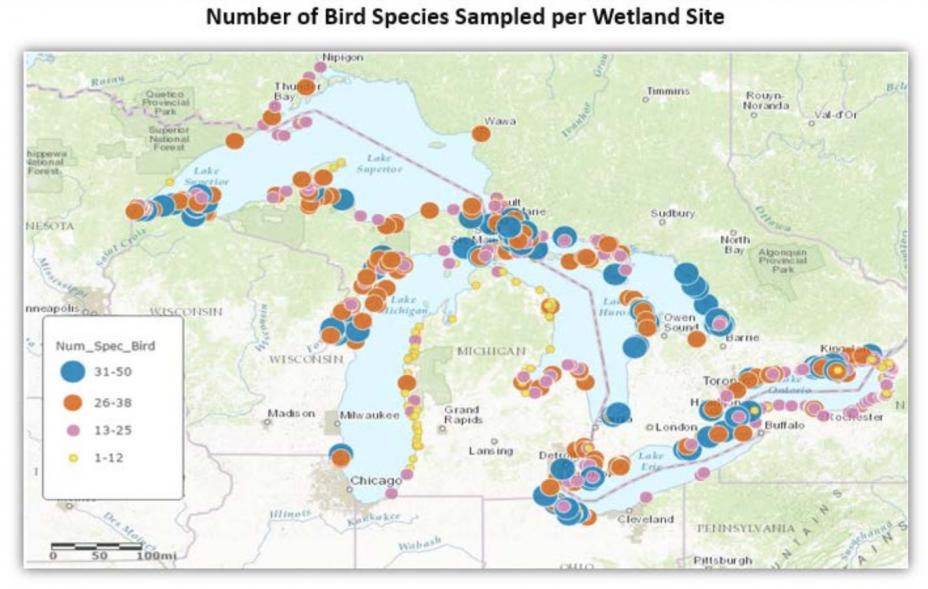
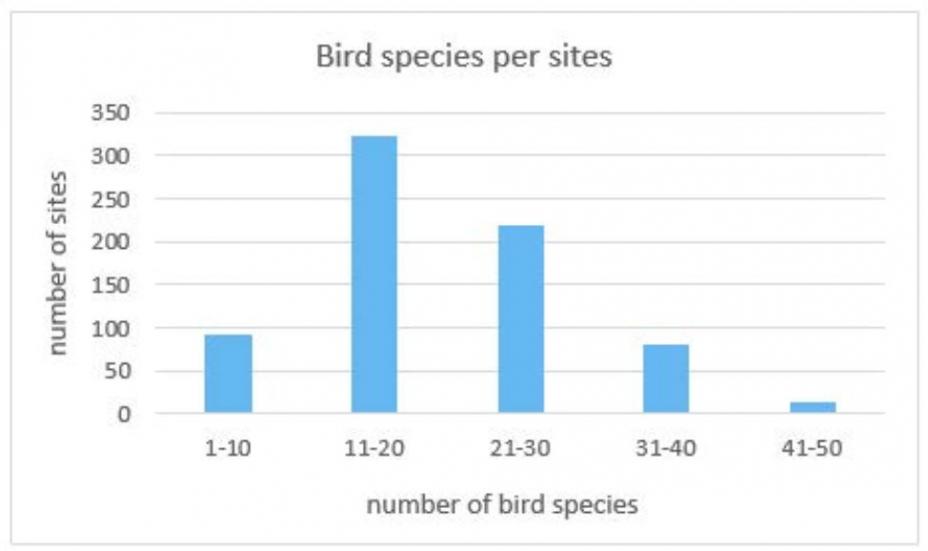
Bird species data collected from 2011 - 2015 can be used to highlight spatial trends (Figure 4). From this, there are notable regions throughout the Great Lakes that have more or less bird species present compared to others. For example, the western shorelines of Lake Michigan appear to have more diversity in the number of bird species than the eastern shore (Figure 5).
 View large version of this picture.
The map shows the distribution of bird species across the Great Lakes region surveyed 2011 - 2015 (Figure 4).
 View large version of this picture.
The bar graph shows the number of bird species per wetland sites sampled 2011 - 2015 (Figure 5).
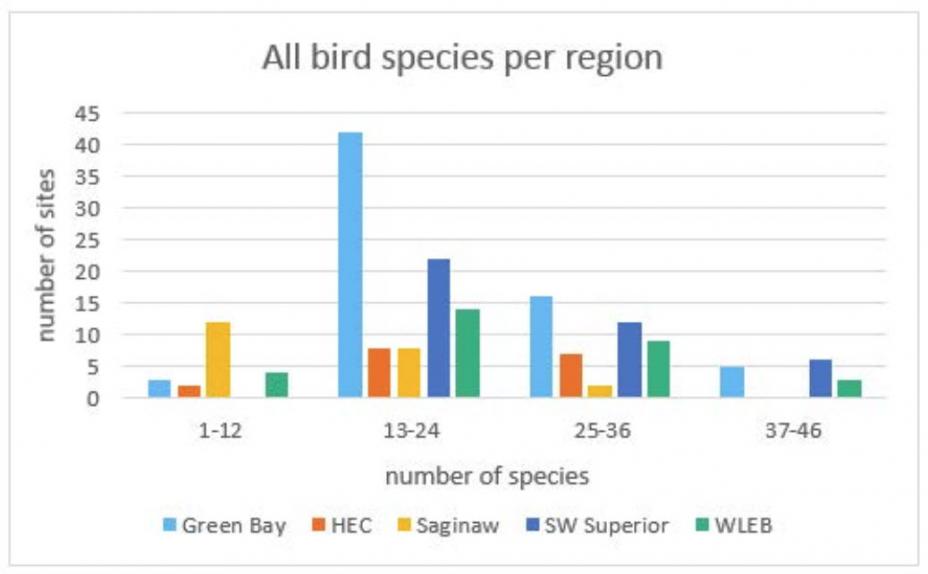
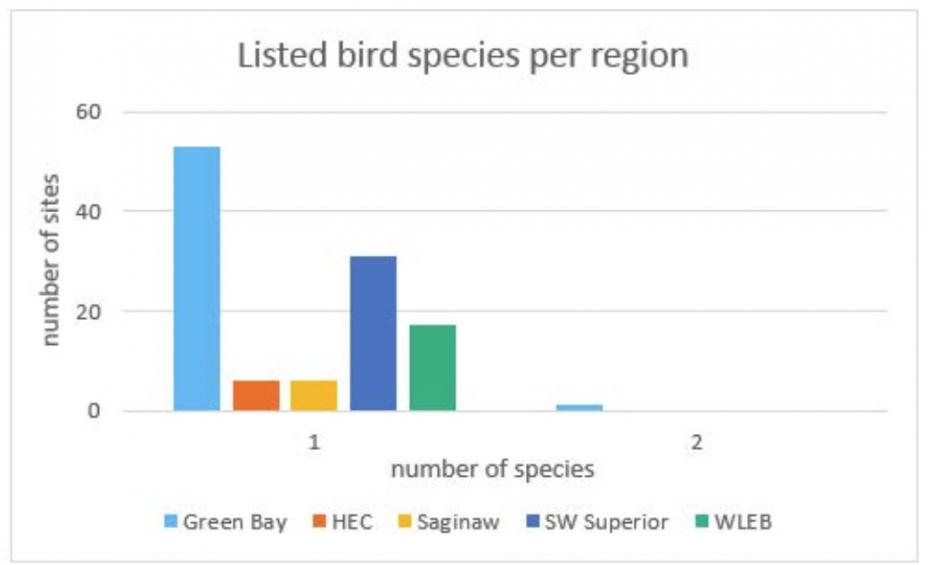
Figures 6 and 7 represent the results of wetland bird surveys from 2011 - 2015 for five geographic regions: Green Bay, the Lake Huron-Lake Erie corridor (HEC), Saginaw Bay, southwest Superior (SW Superior), and the western Lake Erie basin (WLEB). By comparing regions across the Great Lakes basin, the diversity of bird species can be highlighted. The Saginaw Bay and HEC regions would likely benefit from wetland projects focusing on the restoration or enhancement of nesting or stop-over bird habitat.
 View large version of this picture.
The bar graph shows the number of bird species 2011 - 2015 per region (Figure 6). View large version of this picture.
The bar graph shows the number of listed bird species 2011 - 2015 per region (Figure 7).
Fish
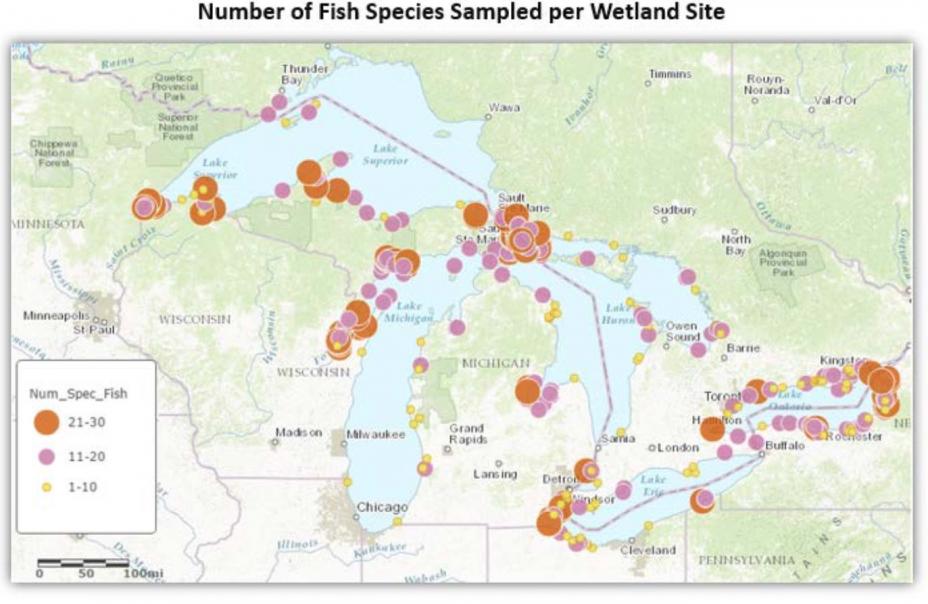
Fish data collected by the CWMP scientists can help determine the spatial distribution of fish species. The map below shows the number of fish species surveyed across the Great Lakes basin from 2011 - 2015 (Figure 8).
 View large version of this picture.
The map shows the fish species distribution across the Great Lakes basin from 2011 - 2015 ( Figure 8).
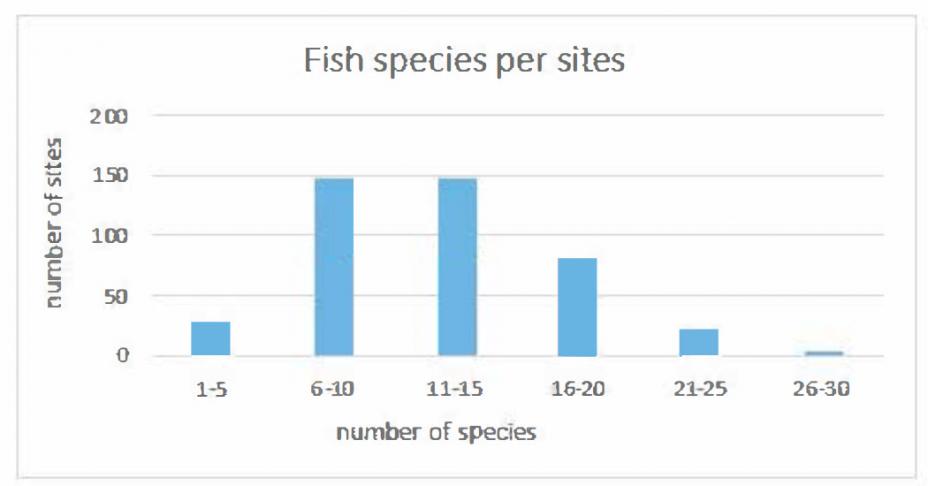
Figure 9 summarizes how many fish species were found at coastal wetland sites sampled. Most commonly, 6 to 15 different fish species were found at about 300 of the 431 wetland sites sampled.
 View large version of this picture.
The bar graph shows the number of fish species per wetland sites monitored 2011 - 2015 (Figure 9).
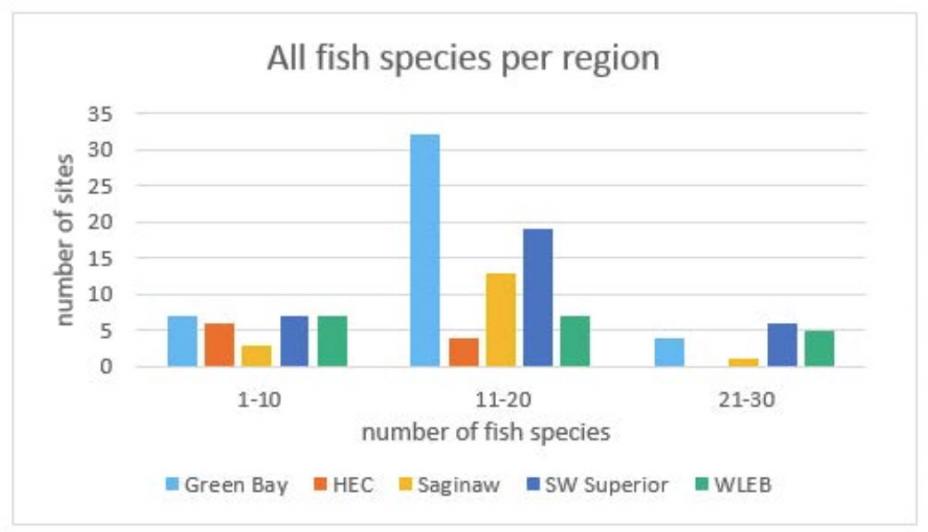
Figures 10, 11, and 12 represent the results of wetland fish surveys from 2011 - 2015 for five geographic regions: Green Bay, the Lake Huron-Lake Erie corridor (HEC), Saginaw Bay, southwest Superior (SW Superior), and the western Lake Erie basin (WLEB). The number of fish species can be summarized as all fish species, listed fish species, and invasive fish species. Data can be used to determine which Great Lakes regions have the greatest or least fish diversity. When coupled with other data collected by the team of scientists, this can be used to gauge the health of the region's wetlands.
 View large version of this picture.
The bar graph shows the number of fish species 2011 - 2015 per region (Figure 10).  View large version of this picture.
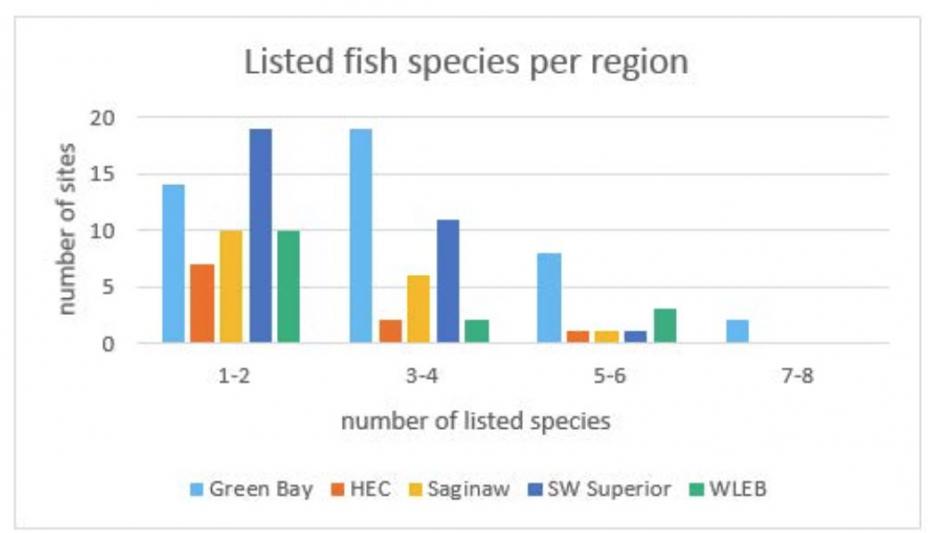
The bar graph shows the number of listed fish species 2011 - 2015 per region (Figure 11).  View large version of this picture.
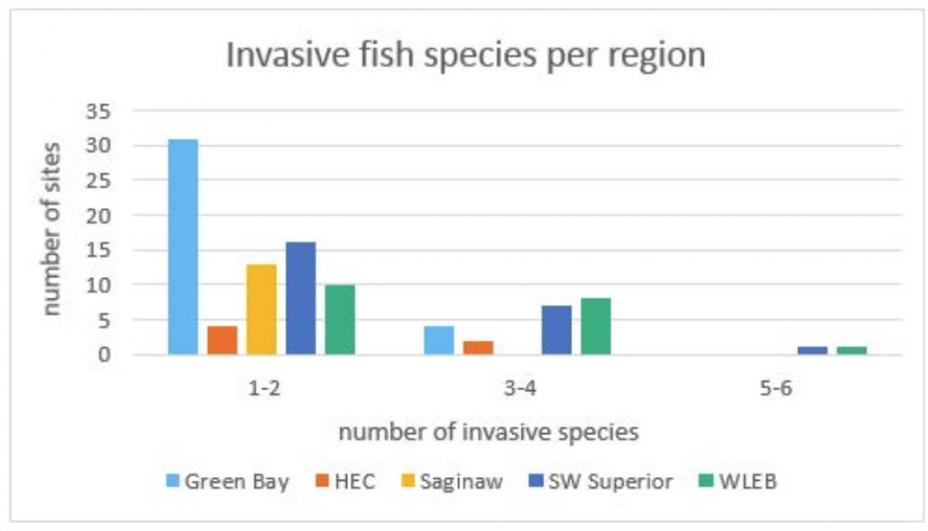
The bar graph shows the number of invasive fish species 2011 - 2015 per region (Figure 12).
Macroinvertebrates
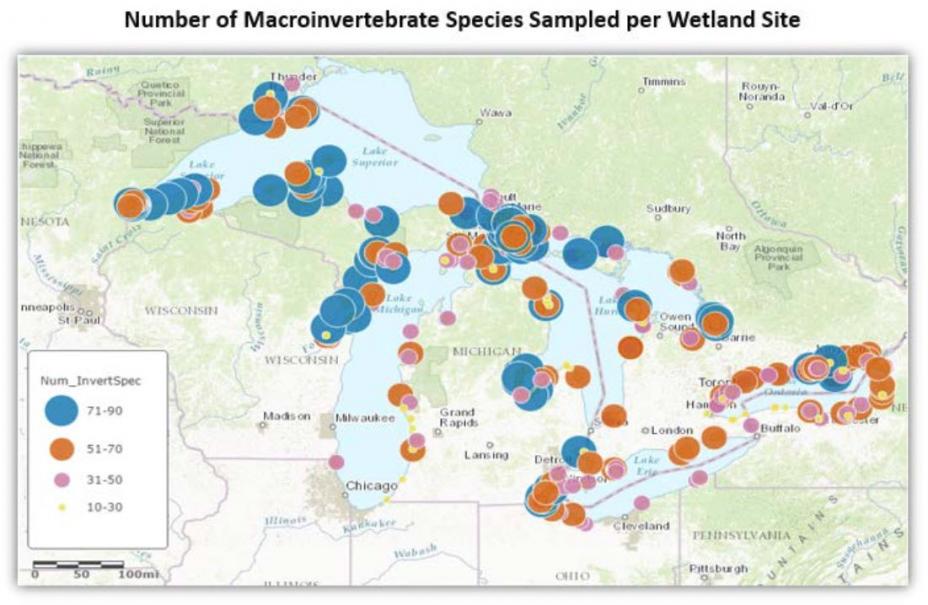
The spatial distribution of macroinvertebrates sampled by the CWMP from 2011 - 2015 are represented in the map (Figure 13). By continuing to sample and survey the coastal wetland sites, any trends occurring over time will be shown.
 View large version of this picture.
The map shows the number of macroinvertebrate species surveyed per wetland site by the CWMP scientists 2011 - 2015 (Figure 13).
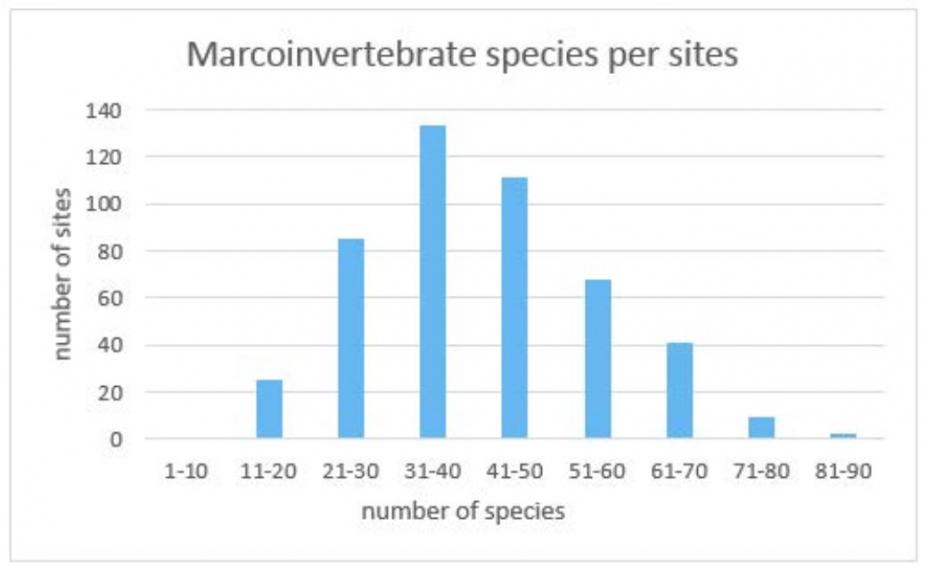
The number of macroinvertebrate species per wetland sites sampled are shown above in Figure 14. About half of all the wetland sites sampled had between 31 to 50 macroinvertebrate species present.
 View large version of this picture.
The bar graph shows the number of macroinvertebrate species per wetland sites sampled 2011 - 2015 (Figure 14).
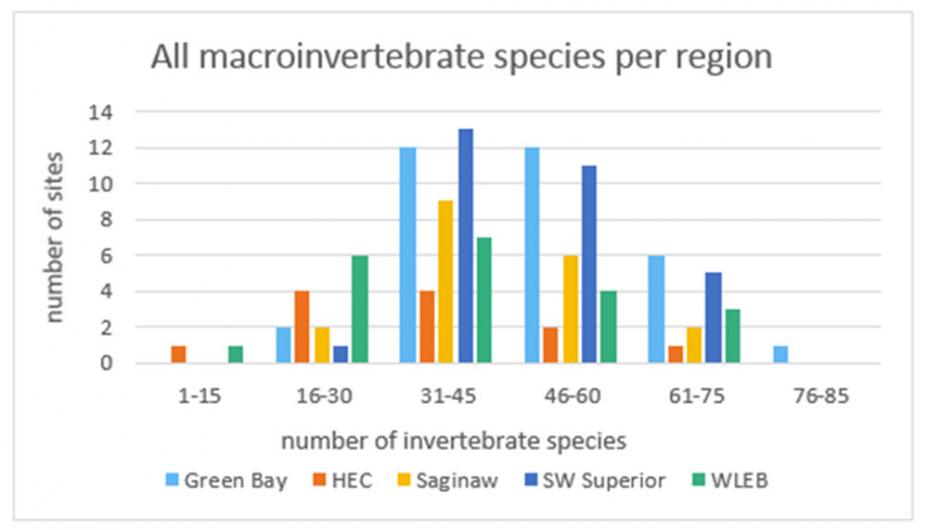
Figure 15 represents the results of wetland macroinvertebrate surveys from 2011 - 2015 for five geographic regions: Green Bay, the Lake Huron-Lake Erie corridor (HEC), Saginaw Bay, southwest Superior (SW Superior), and the western Lake Erie basin (WLEB). Data collected for macroinvertebrates showed that there were only two regions with listed species present, and none of the regions had any invasive species.
 View large version of this picture.
The bar graph shows the number of macroinvertebrate species 2011 - 2015 per region (Figure 15).
Plants
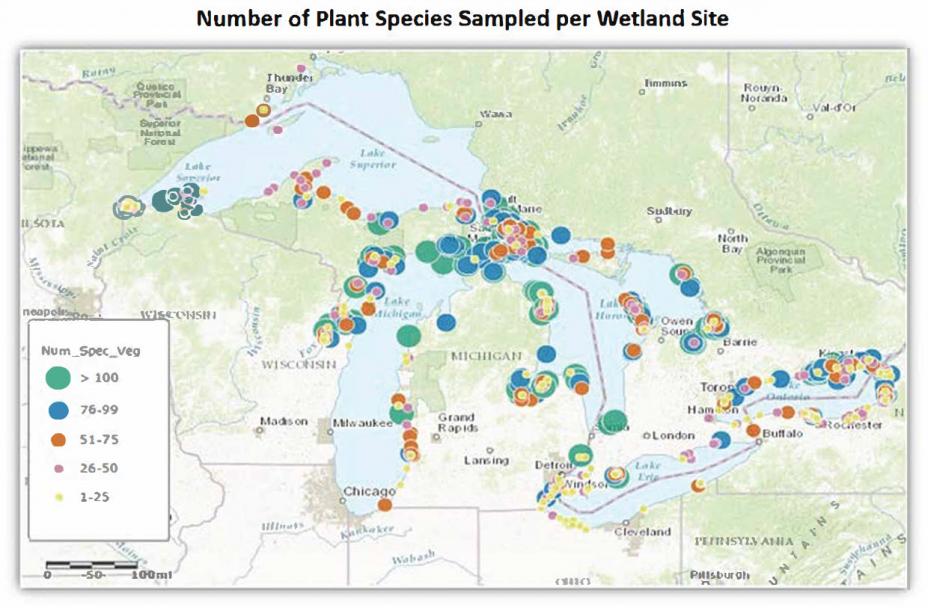
The plant data shown in the map below represent just one of the five taxonomic groups sampled by the team of scientists from 2011 - 2015 (Figure 16). The data can be used to highlight spatial trends, such as the large numbers of plant species per wetland site along Michigan's upper peninsula compared to the Western Lake Erie basin.
 View large version of this picture.
The map shows the number of plant species surveyed per wetland site visited by the CWMP scientists from 2011 - 2015 (Figure 16).
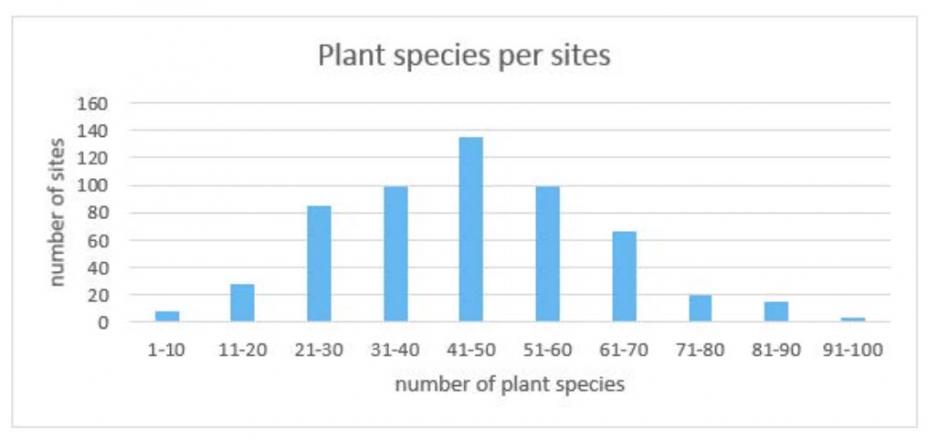
Further information on the number of wetland plant species is represented above (Figure 17). Over 300 of the 558 wetland sites surveyed had between 30 and 60 plant species.
 View large version of this picture.
The bar graph shows the number of plant species found per number of wetland sites surveyed 2011 - 2015 (Figure 17).
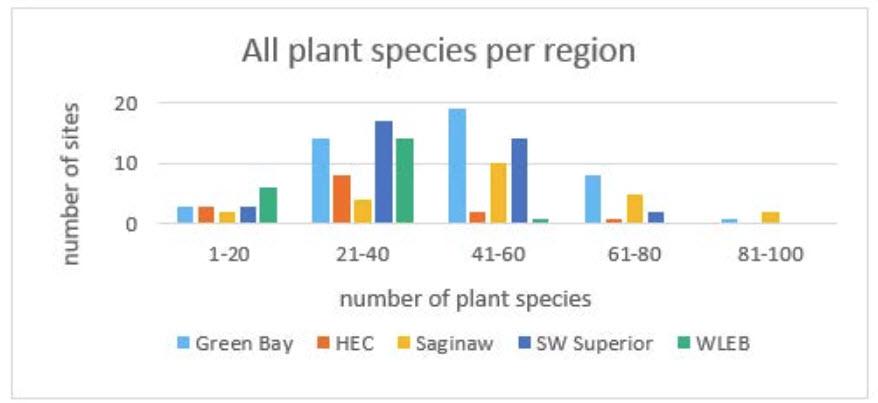
Figures 18, 19, and 20 represent the results of wetland plant surveys from 2011 - 2015 for five geographic regions: Green Bay, the Lake Huron-Lake Erie corridor (HEC), Saginaw Bay, southwest Superior (SW Superior), and the western Lake Erie basin (WLEB). The number of invasive, as well as threatened or endangered plant species can be compared across these regions. When making decisions about where projects on restoration, protection, or invasive species control need to occur, these data are incredibly useful.
 View large version of this picture.
The bar graph represents the number of plant species per sites sampled 2011 - 2015 by region (Figure 18). View large version of this picture.
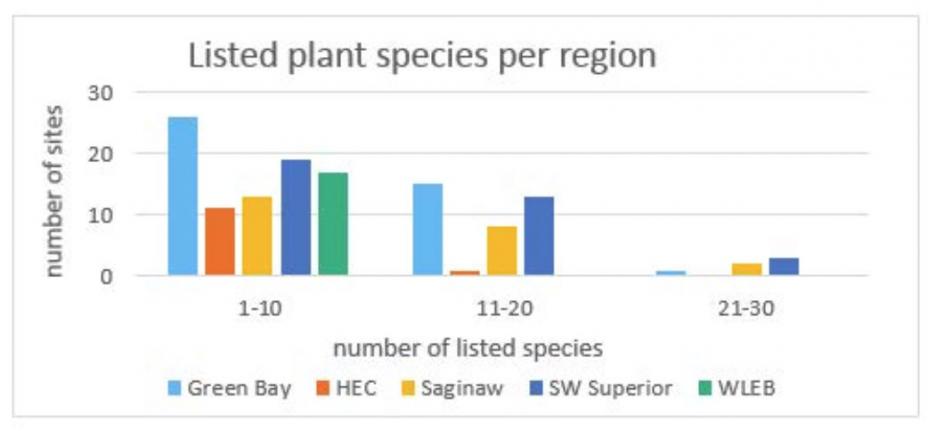
The bar graph shows the number of listed plant species 2011 - 2015 per region (Figure 19). View large version of this picture.
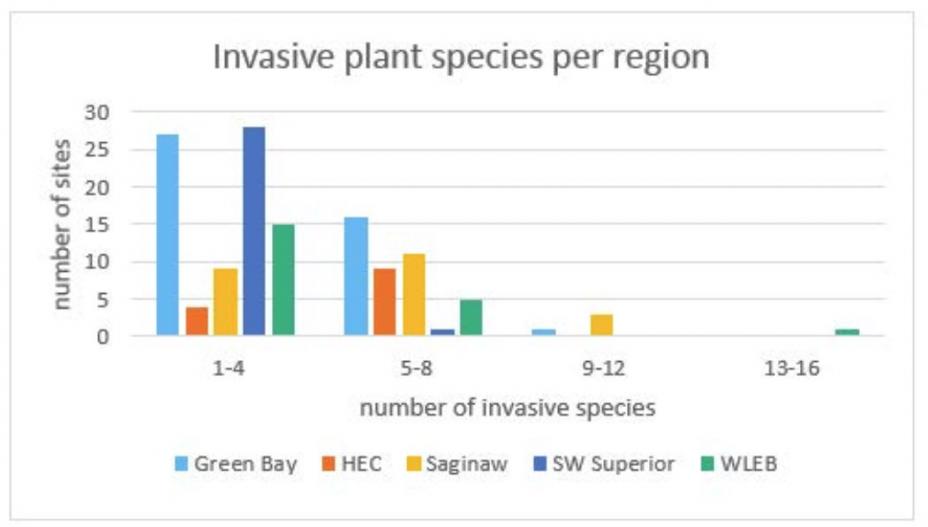
The bar graph shows the number of invasive plant species 2011 - 2015 per region (Figure 20).The WLEB has lower diversity among all plant species compared to the other regions, and a large number of invasive species present. Based on WLEB plant data alone, a restoration project addressing invasive species and the stressors that support their prevalence may be most effective for this region.
Back to: About the Great Lakes Coastal Wetland Monitoring Program