Green Power Partnership Program Updates Issue 64
Issue 64, April 2019
- 2018-19 College and University Green Power Challenge Winners Announced
- Top Partner Rankings & Green Power Communities List Updated April 22
- 2018 – Another Year of Growth for GPP
- Webinar Recap: Guide to Purchasing Green Power
- Green Power in the News
2018-19 College and University Green Power Challenge Winners Announced
Now in its 13th year, the EPA's 2018-19 College and University Green Power Challenge has again been a success, encouraging institutions across the country to use green power. On April 22, EPA announced the winners of the 2018-19 Challenge—out of the 35 competing conferences, the Big Ten is again this year's Collective Conference Champion, using nearly 516 million kilowatt-hours (kWh) of green power annually. Participating schools from the Big Ten Conference include conference winner the University of Maryland, as well as Northwestern University, The Ohio State University, the University of Wisconsin, the University of Minnesota, the University of Illinois at Urbana-Champaign, Michigan State University, and the University of Iowa (listed in order by green power procurement size). The Big Ten collectively increased its green power use over last year's total by nearly 20 million kWh.
This year's individual school using the largest amount of green power—coming in at more than 224 million kWh—is the University at Buffalo, the State University of New York. Joining the University of Maryland (noted above) and University at Buffalo as individual conference champions are Stanford University (Pac-12), University of Tennessee, Knoxville (Southeastern Conference), and the University of Oklahoma (Big 12 Conference).
Learn more about the 2018-19 College and University Green Power Challenge Conference Champions, including all the Individual Conference Champions for each of the competing conferences.
On social media? If you choose, you can tweet this fact: The 109 schools in @EPA's #EPAGreenPower 2018-19 College & University Challenge used nearly 3.6 billion kWh green power this year, which is equivalent to more than 333,000 homes' electricity use for one year! bit.ly/2UDf2fw
Top Partner Rankings & Green Power Communities List Updated April 22
On April 22, GPP released updates to its Top Partner Rankings, which feature Partner organizations leading the way with their use of green power.
With this update, Google has taken the number one spot on the National Top 100 for the first time with its green power use of more than 5.9 billion kilowatt-hours (kWh). Two other Partners in the top five—Microsoft and Equinix—also increased their overall green power use. New to the Top 100 list this quarter are General Motors, LLC and WaferTech, LLC. In total, the Partners featured on the Top 100 list use more than 53 billion kWh of green power. To produce an equivalent amount of power would require nearly 47,000 football fields of solar panels for one year.
Ulta Inc. and LUSH Handmade Cosmetics appear on the Top 30 Retail list for the first time at numbers 19 and 20, respectively. The City of Irving, Texas joins the Top 30 Local Governments list and the Takoma Park, Maryland Community appears on the Green Power Communities list for the first time.
See what else changed on the Top Partner Rankings this quarter.
2018 – Another Year of Growth for GPP
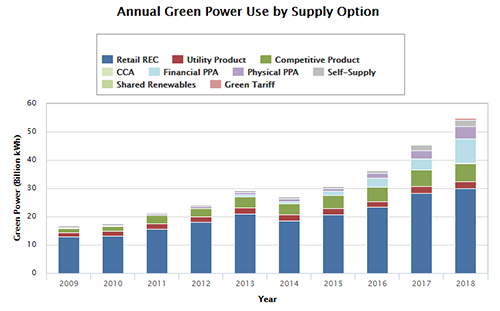
The Green Power Partnership had another year of growth in 2018. Overall, Partners' annual green power use increased to nearly 55 billion kilowatt-hours (kWh), which is a 20 percent increase from 2017. Reported Partner use of green power through financial contracts (i.e., virtual power purchase agreements) increased by 126 percent (more than 4.7 billion incremental kWh), while physical power purchase agreements (PPAs) saw 45 percent growth (more than 1.4 billion incremental kWh) from 2017. Additional updated metrics for the Green Power Partnership are located on our Program Metrics page.
2018 was an important year for emerging green power supply options as well. While they represent a small portion of green power use overall, community choice aggregators (CCAs) grew 223 percent, utility green tariffs realized 327 percent growth, and shared renewables (e.g., community solar) saw an increase in use of 794 percent. The chart below illustrates programmatic growth in 2018 as well as the evolution of green power usage by product type since 2009. The supply option representing the highest proportion of Partners' green power use is retail RECs. Recently, green power use via financial and physical power purchase agreements (PPAs) have been fast-growing supply options. In 2018, financial power purchase agreements overtook competitive green power products as the second leading supply option by kWh.
Growth of Green Power Supply Options from 2009–2018
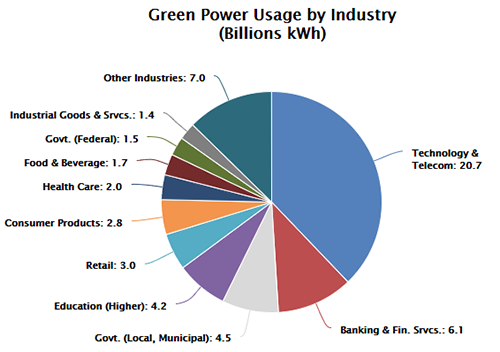
Green Power Usage by Industry
The pie chart below breaks out total green power use in kilowatt-hours (kWh) by primary industry sector. Technology and Telecom is the largest user of green power by industry sector in the Green Power Partnership, followed by the Banking & Financial Services, Local Government, and Higher Education sectors.
GPP Webinar Recap: Guide to Purchasing Green Power
This past fall, a major revision to the Guide to Purchasing Green Power was released. The Guide was authored through the contributions of multiple organizations including EPA's Green Power Partnership, World Resources Institute (WRI), Center for Resource Solutions (CRS), and the U.S. Department of Energy, as well as selected content from the National Renewable Energy Laboratory (NREL).
GPP and CRS held a webinar on April 24th providing an overview of the Guide and the most recent updates, which include new market information and terminology, updated market statistics, new content on direct project engagement procurement options, and new examples of strategies for capturing and communicating benefits.
Speakers:
- James Critchfield, U.S. EPA, Green Power Partnership
- Todd Jones, Center for Resource Solutions
Learn more and review the presentations.
Green Power in the News
Community Solar
- What's New With Community Solar, GreenBiz Energy Weekly: Community solar, a type of shared renewables, is a growing green power model that allows multiple customers to buy, lease, or subscribe to a portion of a shared renewable electricity system located away from their homes or businesses. It increases renewable energy access to homes and businesses that can't install their own system and ensures that the renewable energy is generated locally. Read the article to learn more about the potential benefits, drawbacks, state community solar legislation, and current trends.
- Florida Power & Light Looking to Build the World's Largest Community Solar Program, Energy Manager Today: On April 2, 2019, Florida Power & Light Company (FPL) filed a proposal to start a new community solar program called FPL SolarTogether, which, if approved, would be the largest community solar program in the United States. Pending approval of the Florida Public Service Commission, FPL plans to install 1,490 megawatts (MW) at 20 new solar power plants across FPL's service territory. Check out the article for more information about FPL SolarTogether and potential renewable energy legislation in Florida.
Renewables
- U.S. Renewables Doubled in 10 Years, Houston Chronicle: According to a new report by the U.S. Energy Information Administration, renewable generation provided a new record of 742 million megawatt-hours (MWh) of electricity in 2018, which is nearly double the amount of electricity produced by renewables in 2008. Roughly 90 percent of the growth came from solar and wind sources.
- The State(s) of Distributed Solar—2018 Update, Clean Technica: The Institute for Local Self-Reliance published its annual State of Distributed Solar analysis, which shows that renewable energy continued to grow in 2018 and was helped by the introduction of new solar capacity to the grid. The report includes information about the distribution of solar types in each state and general policy trends.
- Arkansas Bill to Boost Solar, Arkansas Business Journal: The Arkansas state House approved legislation to allow third-party financing of solar arrays and raised commercial project size limits to 1 MW. The measure, already cleared by the state Senate, will open up solar power options for non-taxed entities like nonprofit corporations, government agencies, and schools.
- Purchasing Local Solar Power is a Win-Win for Cities, GreenBiz: Philadelphia's Energy Manager demonstrates the economic development benefits of solar to communities. In December, the Philadelphia Mayor signed a bill for a 20-year power purchase agreement (PPA) with a local solar developer. The PPA will provide 22 percent of the city government's electricity.
![]()


![]()