Light Duty Vehicle Emissions
 Cars, SUVs, and light duty trucks that are fueled by gasoline, diesel, and E85 emit both greenhouse gases and smog-forming pollutants from their tailpipes.
On this page:
Overview
Greenhouse Gas Emissions
- Greenhouse gases (GHGs) are emitted from the tailpipes of cars and trucks that combust fuel.
- Once GHGs are released, they can stay in the atmosphere for 100 years or more.
- GHGs act like a blanket around Earth, trapping energy in the atmosphere and causing it to warm. This can change Earth's climate, raise sea levels, and result in dangerous effects to human health and welfare, and to ecosystems.
Smog Forming Emissions
- Cars and trucks that combust fuel also emit smog forming emissions, such as nitrogen oxide, non-methane organic gases, carbon monoxide, particulate matter, and formaldehyde.
- These emissions are usually trapped close to the ground and can form a brownish haze that pollutes our air, particularly over cities in the summertime.
- Smog can make it difficult for some people to breathe, triggering lung diseases such as asthma, emphysema, and chronic bronchitis, which may lead to premature death.
Electric and hydrogen fuel cell vehicles do not produce tailpipe emissions. Emissions that are related to the production of the fuel used to power vehicles are known as “upstream” emissions. Visit our Beyond Tailpipe Emissions Calculator for specific information on upstream emissions from electric vehicles.
Environmental Ratings on the Label
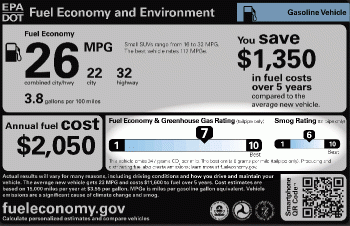 We rate greenhouse gas (GHG) and smog forming emissions separately on the fuel economy label.
The GHG rating reflects carbon dioxide (CO2) emissions. CO2 makes up roughly 99% of the total greenhouse gases emitted from the tailpipe.
The smog rating reflects the current federal emission standards, which cover:
- Oxides of Nitrogen (NOx), which combine with hydrocarbons to create smog
- Particulate Matter (PM), tiny particles of solid matter that lodge in the lungs and deposit on buildings
- Carbon-containing compounds (NMOG [non-methane organic gases], NMHC [non-methane hydrocarbons], or THC [total hydrocarbon content]), that contribute to the formation of ozone and smog
- Carbon Monoxide (CO), a colorless, odorless, and poisonous gas
- Formaldehyde (HCHO), a lung irritant and carcinogen.
The Good News ... Vehicles are getting more efficient.
- The more efficient a vehicle, the fewer greenhouse gases it emits and farther it goes on a single tank of gas, saving people money at the pump.
- Average new vehicle fuel economy increased from 13 mpg in 1975 to 25 mpg today. This means that today a typical passenger car will go, on average, 2 times further on a single tank of gas than it did in 1975. Visit our automotive trends page for more details on how much fuel efficiency is improving.
- Cars and trucks are 98-99% cleaner than they were in the late 1960s for smog-related pollutants, and they're getting cleaner every year. Visit our vehicle emissions page for more details on cleaner emission standards for cars and trucks.
- No matter what size car or truck you need, you now have more efficient, cleaner options. Look for greenhouse gas and smog ratings on the window stickers of all new vehicles.
For more information, visit EPA's sites on:
History
Text-only version of this infographic
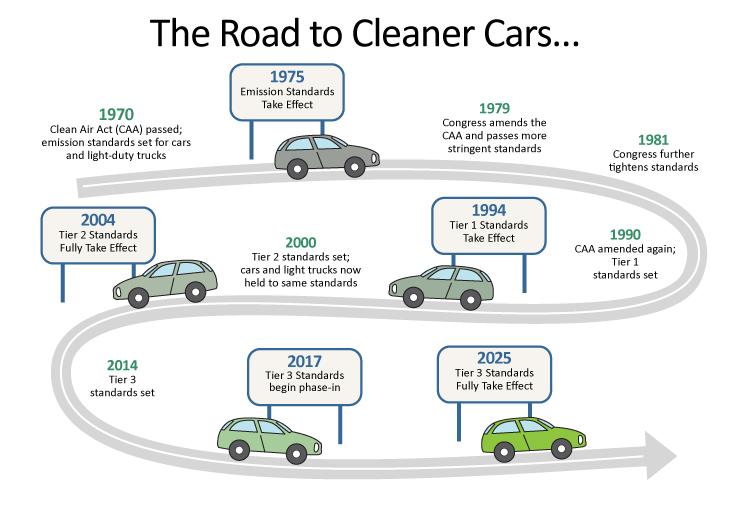
With the passage of the Clean Air Act (CAA) in 1970, the EPA began regulating nitrogen oxide (NOx) emissions from light duty vehicles. The CAA was amended in 1990, and new emission standards were set for four additional smog pollutants:
- Non-methane organic gases (NMOG),
- Carbon monoxide (CO),
- Particulate matter (PM), and
- Formaldehyde (HCHO).
The amendments also gave California authority to pass its own stricter vehicle emission standards, due to its particularly worse air pollution issues. EPA must approve California’s waiver for stricter standards. States may choose to follow either the federal or California standards.
Smog pollution standards were initially different for cars and light duty trucks. In 2000, the Tier 2 program established one set of standards for both cars and light duty trucks. Currently, Tier 3 standards are being phased in.
What vehicles are covered under the smog regulation for cars and light duty trucks?
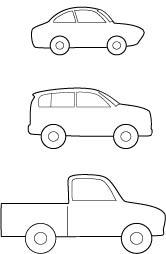 The light duty smog regulations cover passenger vehicles with a gross vehicle weight rating (GVWR) up to 10,000 pounds. GVWR is different than just the weight of a vehicle. It also includes what the vehicle is safely able to carry (i.e., the weight of passengers, cargo, and any optional accessories). This class includes small sedans (e.g., Honda Accord), small pickup trucks (e.g., Ford F-150), and large SUVs (e.g., certain configurations of the Chevrolet Suburban).
Large pickup trucks and vans (e.g., Ford F-350) are considered heavy duty vehicles and are handled differently.
Greenhouse Gases
EPA first set greenhouse gas emission standards for vehicles in 2010, which took effect in MY 2012. The standards were revised in 2012, extending them beyond MY 2016. Learn more about the process here.
Emission Standards
EPA has lowered the amount of pollution light duty vehicles can emit multiple times since the first standards were set in 1970. EPA termed the first emission standards for cars and light trucks “Tier 1” Standards, with Tier 2 and Tier 3 as subsequent updates to the standards. Nearly all cars on the road today are held to either the current Tier 3 standards or the previous Tier 2 standards. The oldest cars on the road (model years 2003 or older) are held to Tier 1 standards.
The current Tier 3 standards are gradually being phased in starting in MY 2017. Tier 3 marks the first time federal and California emissions standards are fully aligned since the initial standards were enacted.
Automakers choose to certify each car model to one of EPA’s smog rating standards, also known as “bins,” but the automaker’s fleet as a whole must meet a specified average. Vehicles certified to a specific bin cannot exceed the amount of pollution specified for that bin. For example, if a vehicle is certified to Bin 50, it cannot emit more than 0.05 grams of NOx + NMOG, 1.7 grams of CO, 0.003 grams of PM, and 0.004 grams of HCHO per every mile it drives.
|
Standard |
Emission Limits (grams/mile) |
|||
|---|---|---|---|---|
|
NOx + NMOG |
CO |
PM |
HCHO |
|
|
Bin 1 |
0 |
0 |
0 |
0 |
|
Bin 20 |
0.02 |
1 |
0.003 |
0.004 |
|
Bin 30 |
0.03 |
1 |
0.003 |
0.004 |
|
Bin 50 |
0.05 |
1.7 |
0.003 |
0.004 |
|
Bin 70 |
0.07 |
1.7 |
0.003 |
0.004 |
|
Bin 125 |
0.125 |
2.1 |
0.003 |
0.004 |
|
Bin 160 |
0.16 |
4.2 |
0.003 |
0.004 |
|
Fleet Average |
0.03 |
-- |
-- |
-- |
- An automaker’s fleet (i.e., all the cars they produce in a given model year) must meet a specified NMOG + NOx average annually. The fleet average limit is lowered each year until MY 2025. The noted fleet average is for the end goal of the regulation (MY 2025).
- A certain percentage of an automaker’s fleet must achieve the set PM emission limit (0.003 g/mi) each year; this percentage increases every year until reaching 100% in MY 2021.
- There is no mandated fleet average for CO or HCHO.
|
Standard |
Emission Limits (grams/mile) |
||||
|---|---|---|---|---|---|
|
NOx |
NMOG |
CO |
PM |
HCHO |
|
|
Bin 1 |
0 |
0 |
0 |
0 |
0 |
|
Bin 2 |
0.02 |
0.010 |
2.1 |
0.01 |
0.004 |
|
Bin 3 |
0.03 |
0.055 |
2.1 |
0.01 |
0.011 |
|
Bin 4 |
0.04 |
0.070 |
2.1 |
0.01 |
0.011 |
|
Bin 5 |
0.07 |
0.090 |
4.2 |
0.01 |
0.018 |
|
Bin 6 |
0.10 |
0.090 |
4.2 |
0.01 |
0.018 |
|
Bin 7 |
0.15 |
0.090 |
4.2 |
0.02 |
0.018 |
|
Bin 8a |
0.20 |
0.125 |
4.2 |
0.02 |
0.018 |
|
Fleet Average |
0.07 |
-- |
-- |
-- |
-- |
- Prior to Tier 3 regulations, NOx and NMOG had separate emission limits.
- There is no mandated fleet average for PM, CO, or HCHO.
Learn more about the previous standards: Federal and California Light-Duty Vehicle Emission Standards for Air Pollutants (PDF) (4 pp, 244 K, September 2019, EPA-420-B-19-043, About PDF). You can also visit EPA’s Emissions Reference Guide for more detailed standards, including the values for different test weights and points in a vehicle’s life.
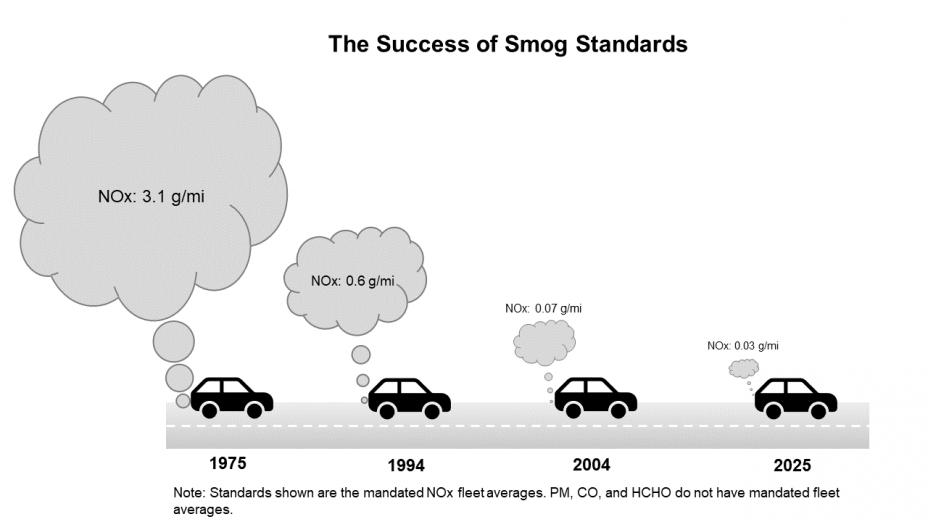
Success
Emission standards have made our air cleaner . . .
Smog pollution emission standards have been strengthened over time making our air substantially cleaner and healthier. NOx emission standards for light duty vehicles in 2025 are a 98% improvement from 1975, and a major driver to the improvements in U.S. air quality.
But NOx pollution is still a problem . . .
- These standards apply only to new cars, so many cars on the road emit more air pollutants than Tier 3 levels.
- These are standards, not total (actual) pollution levels. As we continue to drive an increasing amount,1 strong smog standards can help keep total NOx pollution on a downward trend.2
- In 2018, approximately 125 million people lived in areas where, on average, air pollution was above healthy levels.3 Southern California’s smog levels were above federal standards for almost three months in a row that year. This is the region’s longest stretch of non-compliant days in at least 20 years.4 But unhealthy air is not unique to southern California—nearly half of states had at least one county with unhealthy air in 2018.3
Cleaning up the light duty fleet has put us on a successful path to a cleaner, healthier transportation future. Moving forward, there will be new ways to get around, such as ridesharing, driving zero emission vehicles (like electric and hydrogen fuel cell vehicles), or riding an electric bike (or scooter) that may be even cleaner.
References:
1 US DOT FHWA. Traffic Volume Trends. Last updated Jan 2019. Retrieved from: https://www.fhwa.dot.gov/policyinformation/travel_monitoring/tvt.cfm?CFID=67726059&CFTOKEN=a02073700ad0ab37-AA117DAF-CB42-0DD2-6B72FCBFA604BC94
2 US EPA (2018). 2014 National Emissions Inventory Report. Retrieved from: https://gispub.epa.gov/neireport/2014/.
3https://www3.epa.gov/airquality/greenbook/popexp.html#Notes
4 California Air Resources Board (2018). AQMIS. Retrieved from: https://www.arb.ca.gov/aqmis2/display.php?param=OZONE&units=008&statistic=DMOL8N&year=2018&mon=9&day=19&county_name=--COUNTY--&basin=SC-South+Coast&latitude=--PART+OF+STATE-- &report=AREA1YR&order=basin,county_name,s.name&submit=Retrieve+Data&ptype=aqd&std15=y. Exit