Physiological and Anatomical Visual Analytics
Issue
 Everyday activities have the potential to expose people to a host of chemicals through a variety of pathways. These natural and synthetic chemicals can enter our bodies via inhalation, ingestion, or skin contact. To understand the potential health impacts of chemical exposure, scientists need to be able to understand and predict how the internal organs of the human body are exposed to and process chemicals so that appropriate protective strategies can be developed.
Scientists have developed computer models that are able to predict what happens inside the human body when it is exposed to chemicals. These models are known as physiologically-based pharmacokinetic or (PBPK) models and have the ability to predict the absorption, distribution, metabolism, and excretion of chemicals within the body.
However, data produced by these models is complex and usually displayed in tables, charts, and graphs. This makes it difficult to understand and use when making decisions regarding chemical safety.
Action
To strengthen the usefulness of PBPK modeling data, EPA scientists have developed an innovative modeling framework that displays results from multiple models in a new way that helps scientists see how the human body responds to various chemicals.
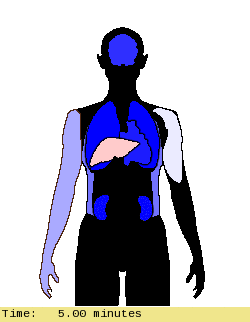
This new web-based modeling tool — known as PAVA (Physiological and Anatomical Visual Analytics) — lets users import and combine results from multiple models and transforms them into animated visualizations to better portray how people’s bodies respond to chemicals.
The absorption, distribution, metabolism, and excretion results are automated and then rendered in a way that lets scientists see changes in chemical concentrations in specific tissues over time — from chemical to chemical, scenario to scenario, and model to model.
Results and Impact
PAVA v1.0 is the first stand-alone Web-based visual analytics tool that is freely distributed to the scientific community to support the development, validation, and communication of physiologically annotated data (PAD). This tool is an example of how innovative technology can be used to enhance understanding of scientific data.
PAVA User Information
Download Pava
- Software and Web requirements
- PAVA registration (required)
- Download PAVA version 1.0(2 MB)
