Guide to retrospective case study data reports
Section 1 – What is being analyzed
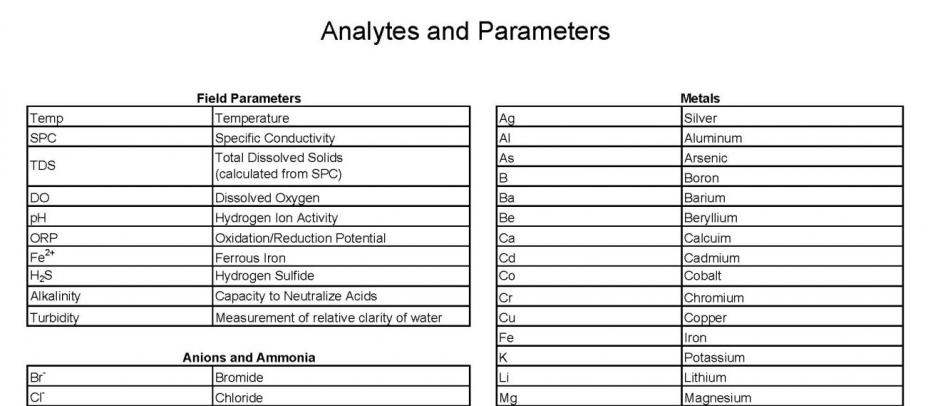
For each case study site, EPA researchers took samples from a variety of sources and tested them for a broad range of substances and chemicals, including components of hydraulic fracturing fluids. Water conditions, such as temperature and dissolved oxygen referred to as “parameters” were also monitored and recorded. These are listed in the first table labeled, “Analytes and Parameters.” (Analytes tab)
Although each case study site has different geology and hydrology, EPA generally uses the same water quality test methods for all the sites to assess conditions in the area.

Section 2 – Understanding the Data
Many of the data have notes and labels that represent important descriptions for understanding what the values listed mean. All of the possible data notes and abbreviations are listed in the following reference tables:
 Click on the individual picture to view larger image
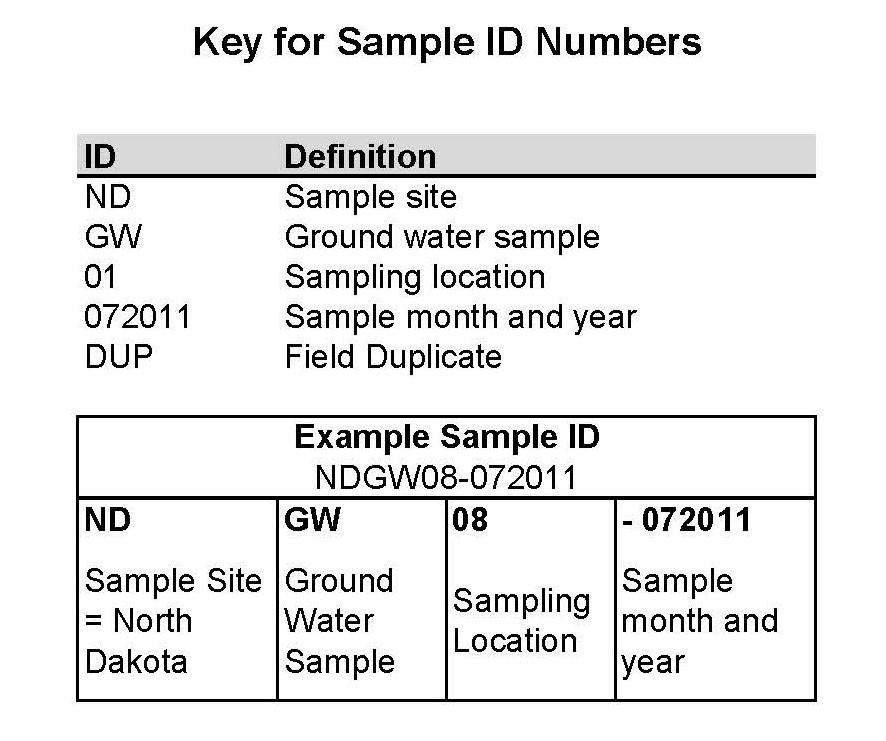
Section 3 – Key for Sample ID Numbers
Each sample taken has a unique identification number. The Key explains the numbering system for the samples.

Section 4 – Data Tables
Data for the samples are grouped together in tables for Parameters, Metals, Volatile Organic Compounds, etc. The sample ID’s will appear in more than one table depending on the analytes included in each table.

Click on the individual picture to view larger image