S.H. Bell Chicago Air Monitoring Data
EPA has required environmental air monitoring of the S.H. Bell Company facility in Chicago, Ill.
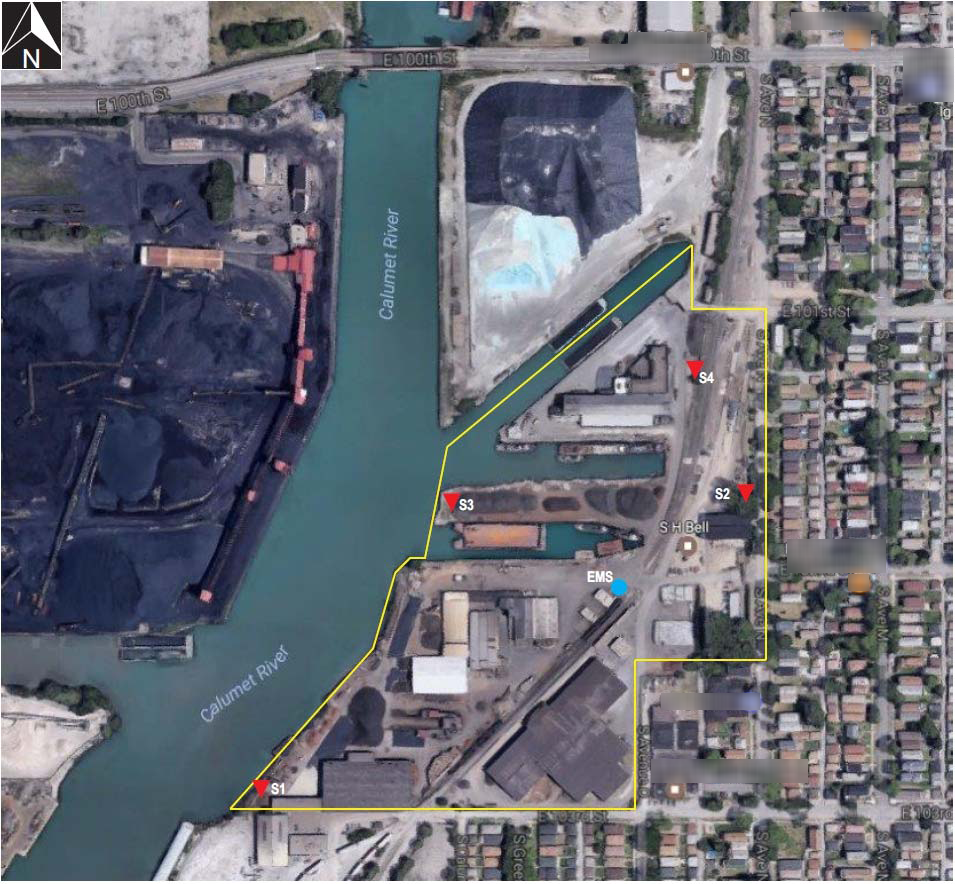
Monitor Locations
| Monitoring Site ID | Approximate Location | Monitoring Equipment | |
|---|---|---|---|
| Northing | Easting | ||
| S1 | 41.708239 | -87.544058 | BAM-1020 monitor for PM10 (Continuous FEM) |
| S2 | 41.710553 | -87.539204 | BAM-1020 monitor for PM10 (Continuous FEM) |
| S3 | 41.710552 | -87.542043 | BAM-1020 monitor for PM10 (Continuous FEM) Agilaire 8872 Datalogger |
| S4 | 41.711541 | -87.539607 | BAM-1020 monitor for PM10 (Continuous FEM) Two (2) Tisch Environmental HiVol 6070 DVBL Filter-Based FRM PM10 Monitors |
| EMS (Existing Monitoring Station) |
41.709841 | -87.540376 | Meteorological monitors (Climatronics: Wind Speed, Wind Direction, Temperature, Barometric Pressure, Data Logger) |
Placement of the monitors is illustrated in the map below. Click on the map to view a larger image.
Air Monitor Data
EPA has developed various pollution and wind roses with the March 1, 2017, through June 30, 2017, air monitoring data.
View the S.H. Bell Chicago Pollution Roses.
View the S.H. Bell Chicago Pollution Roses.
- A wind rose is a diagram that shows the distribution of wind direction over a period of time.
- A pollution rose is a graphical display of wind direction frequency for winds having certain amounts of a particulates.
- Additional information on wind and pollution roses. (Air Pollution Control Orientation Course Unit 3 Air Pollution Meteorology, p. 48)
| Month |
Continuous Hourly PM10 Data |
|||
|---|---|---|---|---|
| S1 | S2 | S3 | S4 | |
| March 2017 - July 2020 | ||||
| Month | Filter-based Monitor (S4) Data From the FRM Monitor |
|---|---|
| March 2017 - July 2020 | Filter-based Monitor (S4) Data From the FRM Monitor(256 K) |