Summarized Data of the Building Assessment Survey and Evaluation Study
Building and Test Space Characteristics
Information on the physical characteristics of the building and potential sources of indoor and outdoor pollution around and within the building was acquired through a combination of a building walk-through and discussions with the building management. This information was generally collected during the initial visit to the building and verified by the field team during the study week.
1. Whole Building Physical Characteristics
The BASE study collected data from 100 randomly selected buildings in 37 cities in 25 States. Ownership of the BASE buildings was primarily split between private and commercial (n=41) and government (n=44), the remaining 15 buildings were classified as academic. Most of the BASE study buildings were classified as being in urban surroundings (73%). Twenty-three percent were in suburban surroundings and 4% were in rural surroundings.
- Building Age : The age of BASE buildings varied considerably from buildings constructed prior to 1900 to buildings constructed in the 1990’s. The highest percentage of BASE buildings was constructed in the 1980’s (30%) followed by a large number of buildings constructed in the 1960’s and 1970’s.
- Building Size: The BASE buildings are most representative of large office buildings with 50 or more employees. It is estimated that the office buildings with 50 or more employees roughly represent 11% of the US office building stock and 73% of all US office workers.
- A detailed discussion of the "representativeness" of the BASE data to the US building stock can be found in chapter 5 of the Summary and Analysis report of the BASE Study Building Selection Process.
- A detailed discussion of the "representativeness" of the BASE data to the US building stock can be found in chapter 5 of the Summary and Analysis report of the BASE Study Building Selection Process.
- Building Floor Area: The overall gross floor area of BASE buildings ranged from 1,665 square meters to 134,195 square meters. The median occupied floor area was 8,477 square meters (1,444,475 square feet) and ranged between 629 square meters (6,771 square feet) and 98,474 square meters (1,059,974 square feet).
- Building Stories: The BASE study included single-story buildings as well as buildings that were thirty stories and greater. Most of the buildings however, were ten stories or less. Twenty-five percent of the BASE Buildings were buildings between one and three stories.
- Occupancy: The total building occupancy was obtained from interviews with building staff. Typical building occupancy including visitors refers to the total number of people, employees and visitors that occupy the building during normal business hours. The distribution of total building occupancy across the BASE study buildings is presented graphically below. The median total occupancy of the study buildings was 705, the minimum was 87 and the maximum was 6,500.
- Operable Windows: Operable windows can be used as a ventilation strategy in naturally ventilated buildings and can also supplement ventilation provided through a building mechanical system. For BASE buildings, fifty-five had non-operable windows and 44 had some percentage of windows that were operable. One building studied was not equipped with windows.
- Download a detailed summary of information collected on the Whole Building Physical Characteristics.
- Download detailed information on Test Space Physical Characteristics.
A. Building Age
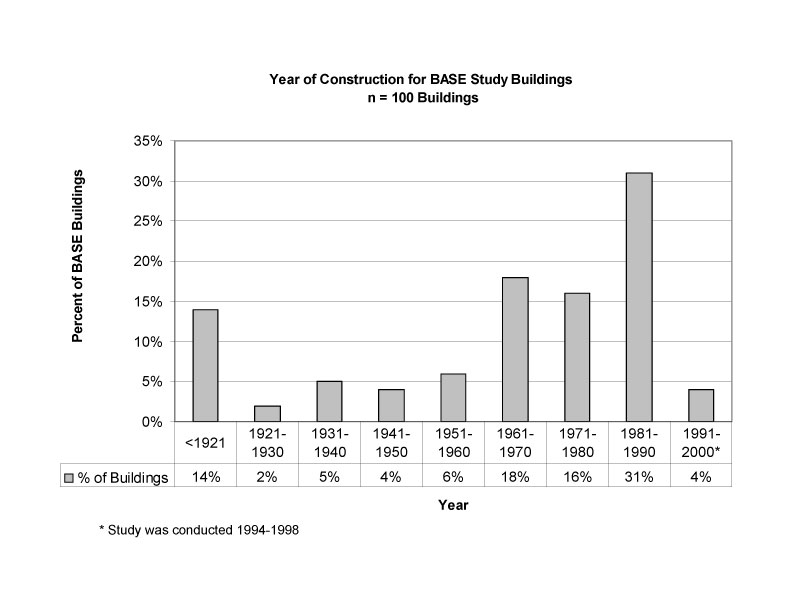
figure caption: Year of Original Construction for BASE Study Buildings
C. Building Floor Area
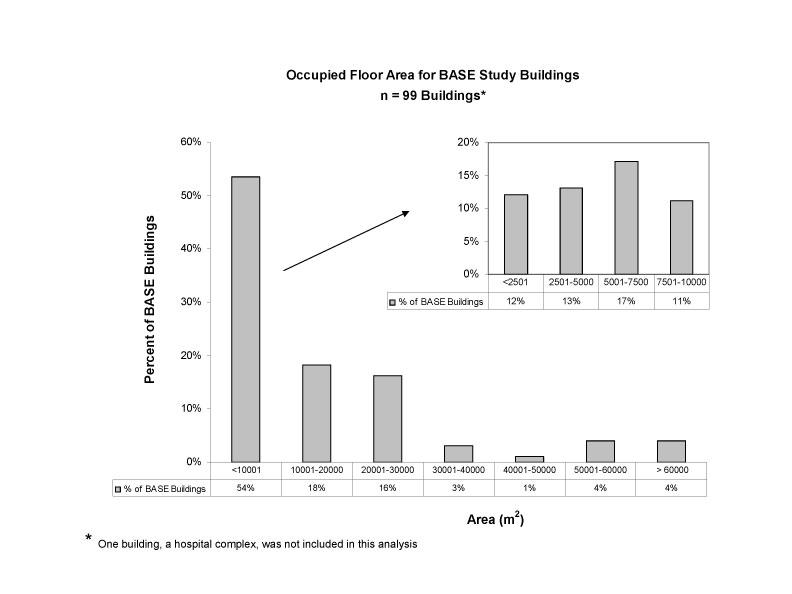
figure caption: Occupied Floor Areas of BASE Study Buildings by Area
D. Building Stories

figure caption: Total Number of Floors for BASE Study Buildings
E. Occupancy
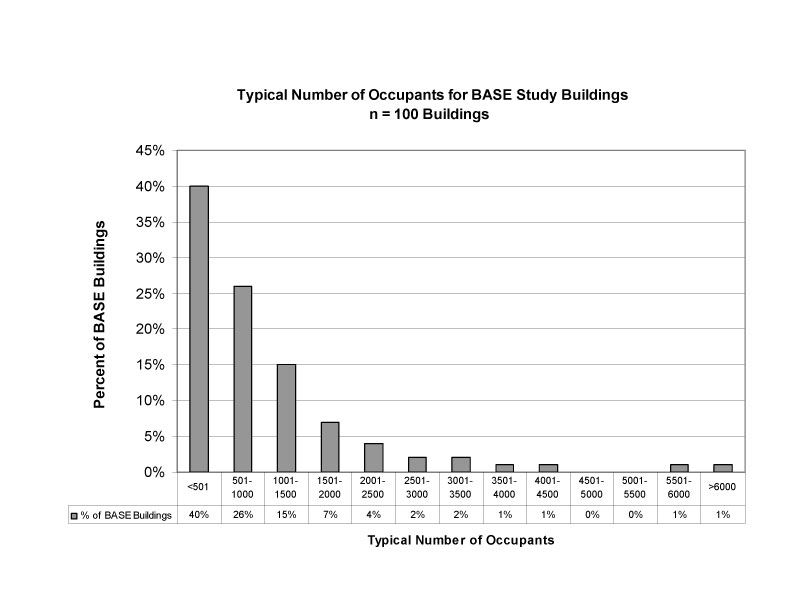
figure caption: Typical Number of Occupants for BASE Study Buildings
F. Operable Windows
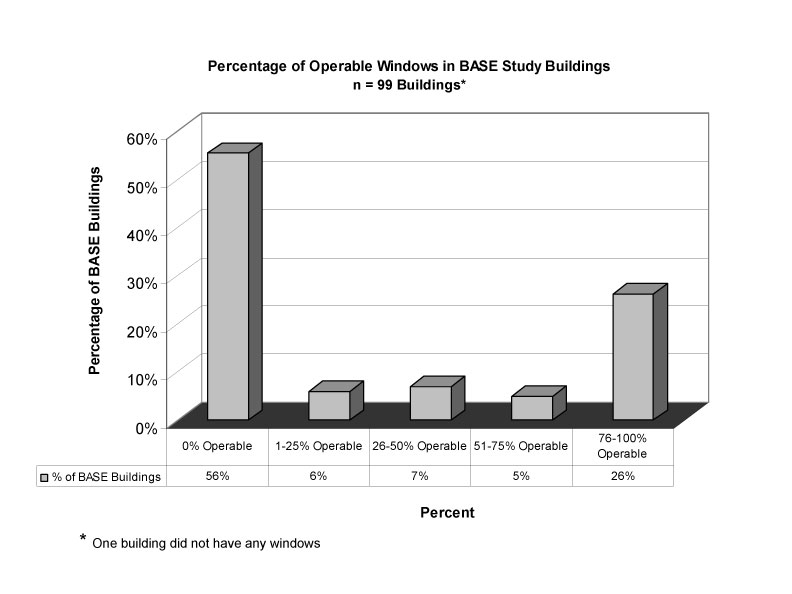
figure caption: Percentage of Operable Windows in BASE Study Building
2. Whole Building Pollutant Sources
For each building, information was collected regarding sources that may have potential impact on the building in terms of indoor air quality. These may include sources such as past or current water damage, pesticide application practices, special use spaces, etc.
- Special Use Spaces: A variety of special spaces were found within the BASE study buildings. The types and frequencies of special use spaces are shown below. Of particular interest is that many of these special use areas with activities that generate indoor pollutants did not have dedicated ventilation systems or exhaust systems.
- Water Damage: Eighty-five percent of the buildings experienced water damage in the past, which may be largely related to the wide-ranging age of BASE buildings. Forty-five percent of the buildings were experiencing ongoing problems with leaks causing water damage, 34% of the buildings had current leaks in occupied spaces. For the buildings reporting past water damage and current water leaks, the majority was reported to have occurred in the occupied spaces of the building.
- Fire Damage: Twelve of the 100 BASE buildings reported damage to the building caused by fire. In all cases, the fire damage was limited to localized areas of the building.
- Pest Control: Fifteen percent of the buildings had no interior pesticide applications and 33% of the buildings had no exterior pesticide applications. It is worth noting that the most common interior pesticide application interval was monthly (34%). Another thirty-one percent of the buildings had interior pesticide applications on an as-needed basis. The most common exterior application interval was on an as-needed basis (33%). Further, interior pesticide applications exceeded exterior pesticide applications.
- Download a detailed summary of information collected on Whole Building Pollutant Sources.
- Download detailed information on Test Space Pollutant Sources.
A. Special Use Spaces
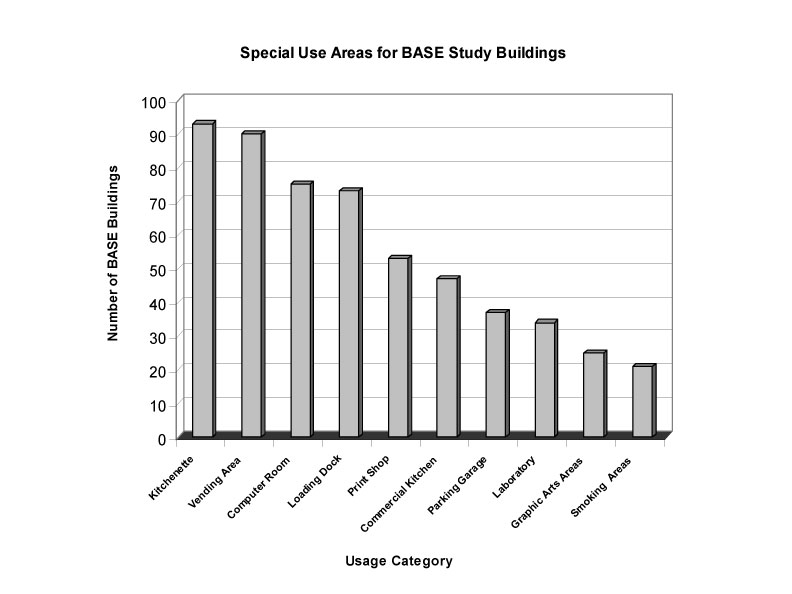
figure caption: Special Use Areas Among BASE Study Buildings
B. Water Damage

figure caption: Past Water Damage and Current Water Leaks Among BASE Study Buildings
D. Pest Control
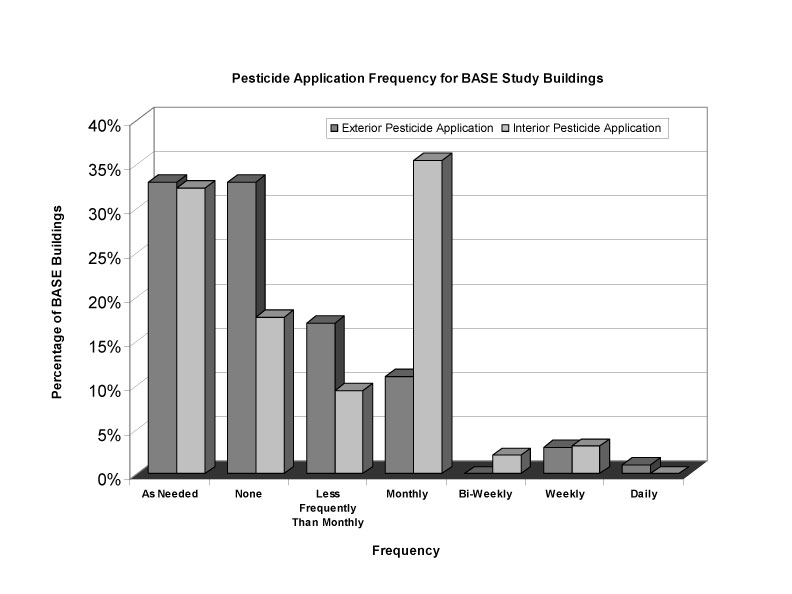
figure caption: Interior and Exterior Pesticide Application Frequency Among Base Study Buildings
HVAC Characteristics
Information on the characteristics of the heating, ventilation and air conditioning (HVAC) system(s) in the entire BASE building including types of ventilation, equipment configurations, and operation and maintenance issues was acquired by examining the building plans, conducting a building walk-through, and speaking with the building owner, manager, and/or operator. This information was collected using standard forms available in the appendices of the protocol during the building preliminary visit, and verified by the field team during the study week.
- For more information about the Protocol, see the Study Overview of the Building Assessment Survey and Evaluation Study
Within each test space information related to the air handling and distribution systems serving the test space and the operation and maintenance practices used for these systems were collected during the study week.
Whole Building HVAC Characteristics
- Ventilation Strategy: Ventilation provided to BASE Buildings was introduced through mechanical or natural means. Two of the 100 BASE Buildings relied solely on natural ventilation while all other buildings had some form of mechanical ventilation. One building utilized natural ventilation in the study area and mechanical ventilation in other areas of the building.
- Building Cooling Systems: Ninety-one of the BASE buildings were equipped with some sort of cooling system. Some BASE buildings relied on a combination of two or more cooling systems as the primary cooling. The predominant type of primary cooling system employed in BASE buildings consisted of central air handling systems with chilled water cooling coils as shown graphically below. Roughly three quarters of the buildings were equipped with central chiller systems.
- Building Heating Systems: All of the BASE study buildings were equipped with some sort of heating system. Over 75% of the buildings used steam or hot water as the primary means of space heating. For these buildings, one quarter were served by central heating plants not located in the building. The predominant type of heating system employed in BASE buildings consisted of central air handling systems with heating coils.
- Download a detailed summary of information collected on Whole Building HVAC Characteristics.
- Download detailed information on Test Space HVAC Characteristics.
- Download detailed information on Test Space HVAC Inspections.
B. Building Cooling Systems
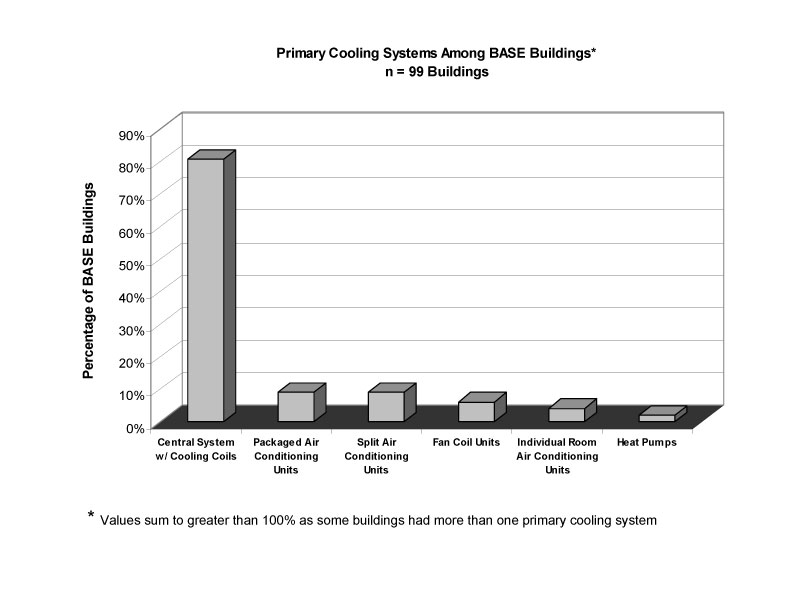
figure caption: Primary Cooling Systems Among BASE Study Buildings
C. Building Heating Systems
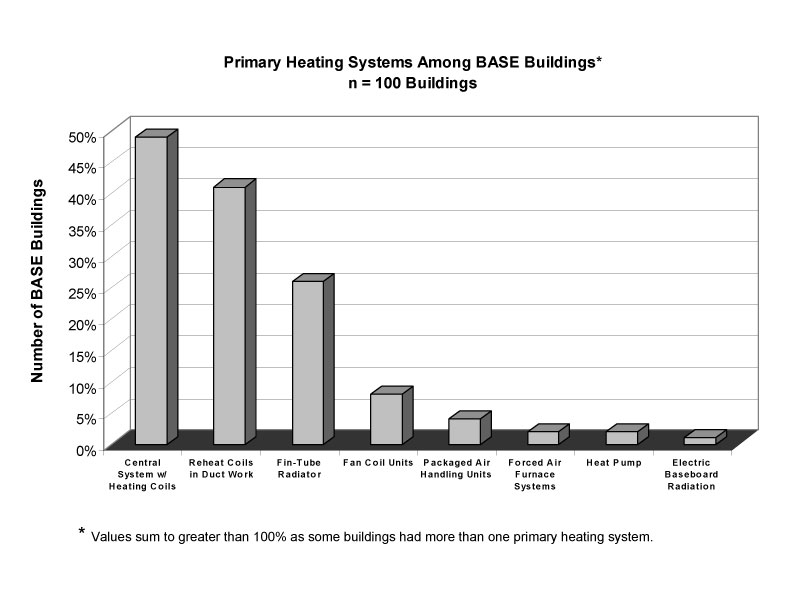
figure caption: Primary Heating Systems Among BASE Study Buildings
Environmental Parameters
Volatile Organic Compounds
Volatile organic compounds (VOCs) were collected in 100 buildings at three randomly selected indoor locations and at one outdoor location using the standardized protocol. Time-integrated samples using the SUMMA® canister method were collected in all building test spaces. In the last 70 building test spaces, samples using multisorbent tubes were collocated with the SUMMA® canisters. Time-integrated aldehyde samples were collected at the same indoor and outdoor locations in 100 building test spaces.
- For a more detailed discussion of collection methodology, see the Building Assessment Survey and Evaluation Study Methodology.
Because many of the compounds were determined using multiple sample methods (except for aldehyde samples), EPA compiled a “master list” of VOCs from the SUMMA® canister and multisorbent tube sampling methods. In developing this list, comparisons were made between the frequency that a specific chemical was detected using the SUMMA® method, and the frequency that the same chemical was detected using the multisorbent method. The method selected for the master list was based on the method that yielded the greater detection frequency. If both detection methods for a specific chemical had a similar detection frequency, the precision of reported concentrations for duplicate samples for a given method (duplicates were taken at one of the three indoor sites and outdoors in each building using both sampling methods) was used to determine which method’s results to report. When only one of the two sampling methods detected a chemical, that result was used on the master list by default. Mean, median and fifth and ninety-fifth percentiles for the "master list" VOCs are presented in decreasing order of building frequency detected indoors (in percent).
Volatile Organic Compounds Master List
Box and Whisker Plot
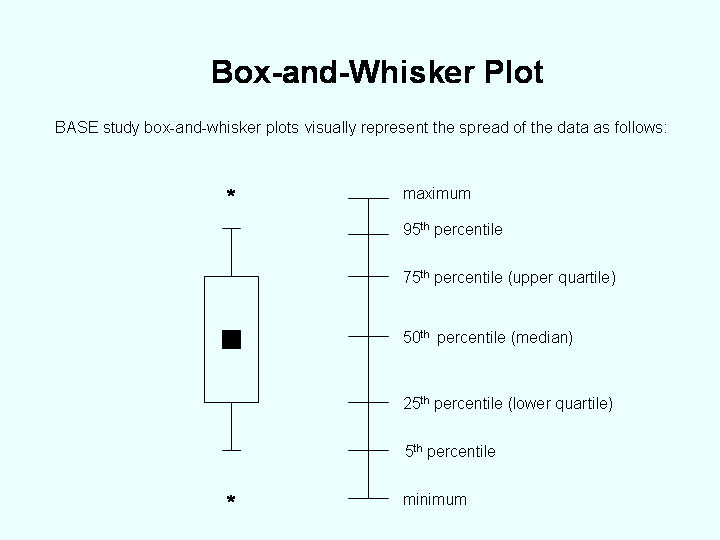
- Download the Distribution of BASE VOC Concentrations at All Sampling Sites for the Analytes listed in the tables below.
- Also provided as background, is a Box-and-Whisker Plot chart that describes the typical spread of data. A more detailed discussion of changes in methodology and target Analyte can be found in the 2003 Standardized BASE Protocol.
- 100% Building Frequency of Detection Indoors
- 75% - 99% Building Frequency of Detection Indoors
- 1% - 74% Building Frequency of Detection Indoors
- Not Detected in BASE Study Buildings Indoors
100% Building Frequency of Detection Indoors
| Analyte (Indoors) | Number of Buildings |
Building Frequency Detected Indoors (%) |
Analyte Concentration Indoors Percentile (ug/m3) |
Analyte Concentration Indoors Arithmetic Mean (ug/m3) |
||
|---|---|---|---|---|---|---|
| 5th | 50th | 95th | ||||
| Acetaldehyde | 86 | 100 | 2.6 | 7.2 | 15 | 7.8 |
| Acetone | 70 | 100 | 9.9 | 30 | 110 | 42 |
| Benzene | 70 | 100 | 1.1 | 3.6 | 9.1 | 4.2 |
| Nonanal | 41 | 100 | 1.5 | 3.6 | 7.9 | 4.3 |
| Toluene | 70 | 100 | 2.7 | 8.7 | 39 | 16 |
| 1,1,1-Trichloroethane | 70 | 100 | 0.97 | 3.1 | 21 | 11 |
| Chloromethane | 87 | 100 | 1.8 | 2.5 | 4.3 | 2.9 |
| Ethylbenzene | 70 | 100 | 0.43 | 1.5 | 6.2 | 2.4 |
| Formaldehyde | 100 | 100 | 4.4 | 15 | 32 | 16 |
| m- & p-Xylenes | 70 | 100 | 1.3 | 5.1 | 24 | 8.4 |
| n-Decane | 70 | 100 | 0.79 | 2.9 | 24 | 6.3 |
| n-Dodecane | 70 | 100 | 0.99 | 3.5 | 14 | 5.4 |
| n-Undecane | 70 | 100 | 0.96 | 4.0 | 19 | 6.3 |
| o-Xylene | 70 | 100 | 0.59 | 2.1 | 8.2 | 3.1 |
| 1,2,4-Trimethylbenzene | 70 | 100 | 0.61 | 1.9 | 12 | 3.3 |
| d-Limonene | 70 | 100 | 1.1 | 7.1 | 44 | 12 |
| Hexanal | 41 | 100 | 1.5 | 4.1 | 12 | 5.4 |
| Phenol | 41 | 100 | 0.38 | 1.8 | 7.3 | 2.5 |
| Ethyl Acetate | 70 | 100 | 0.34 | 2.0 | 7.5 | 3.7 |
| Tetrachloroethene | 70 | 100 | 0.3 | 1.5 | 18 | 3.8 |
| 2,2,4-Trimethyl-1, 3-Pentanediol Diisobutyrate |
41 | 100 | 0.26 | 0.74 | 2.4 | 1.1 |
| 2-Ethyl-1-Hexanol | 41 | 100 | 0.26 | 1.2 | 5.1 | 1.8 |
| Nonane | 70 | 100 | ≤ LOQ | 0.94 | 10 | 2.8 |
| Ethanol | 13 | 100 | ≤ LOQ | 79 | 260 | 89 |
| 2-Propanol | 13 | 100 | ≤ LOQ | 30 | 320 | 73 |
| Note: Time-integrated air sampling for VOCs was collected in all 100 study buildings. The SUMMA canister method (method CAN) and aldehyde sample method (method ALD) were used in all 100 buildings, while the multisorbent method (method TNX) was used for the last 70 buildings studied. In addition, because the target VOC analyte list underwent some revision over the course of the BASE study, some analytes were sampled at fewer than the full 100 buildings. | ||||||
75% - 99% Building Frequency of Detection Indoors
| Analyte (Indoors) | Number of Buildings |
Building Frequency Detected Indoors (%) |
Analyte Concentration Indoors Percentile (ug/m3) |
Analyte Concentration Indoors Arithmetic Mean (ug/m3) |
||
|---|---|---|---|---|---|---|
| 5th | 50th | 95th | ||||
| 2-Butanone | 70 | 99 | 0.81 | 2.6 | 7.8 | 3.3 |
| Styrene | 70 | 99 | 0.091 | 0.91 | 3.0 | 1.3 |
| Octane | 70 | 99 | ≤ LOQ | 0.85 | 6.4 | 3.3 |
| 2-Butoxyethanol | 41 | 98 | 0.036 | 5.5 | 68 | 12 |
| n-Hexane | 41 | 98 | ≤ LOQ | 2.5 | 12 | 3.9 |
| Valeraldehyde (Pentanal) | 41 | 98 | ≤ LOQ | 1.2 | 4.0 | 1.6 |
| Dichlorodifluoromethane | 87 | 97 | ≤ LOQ | 6.8 | 36 | 33 |
| 4-Ethyltoluene | 70 | 96 | ≤ LOQ | 0.77 | 4.1 | 1.3 |
| Butyl Acetate | 70 | 94 | ≤ LOQ | 1.5 | 10 | 3.1 |
| a-Pinene | 70 | 94 | ≤ LOQ | 0.57 | 3.1 | 0.94 |
| 2,2,4-Trimethyl-1, 3-Pentanediol monoisobutyratel | 41 | 93 | ≤ LOQ | 2.5 | 19 | 5.4 |
| 1,3,5-Trimethylbenzene | 70 | 93 | ≤ LOQ | 0.54 | 3.9 | 1.0 |
| 4-Methyl-2-Pentanone | 70 | 93 | ≤ LOQ | 1.0 | 7.2 | 2.2 |
| 1-Butanol | 41 | 90 | ≤ LOQ | 2.1 | 10 | 3.3 |
| Naphthalene | 70 | 90 | ≤ LOQ | 0.73 | 2.6 | 0.95 |
| Methylene Chloride | 100 | 81 | ≤ LOQ | 2.9 | 16 | 21 |
| 1,4-Dichlorobenzene | 70 | 77 | ≤ LOQ | 0.54 | 13 | 2.8 |
| Trichlorofluoromethane | 100 | 73 | ≤ LOQ | 3.9 | 51 | 19 |
| Note: Time-integrated air sampling for VOCs was collected in all 100 study buildings. The SUMMA canister method (method CAN) and aldehyde sample method (method ALD) were used in all 100 buildings, while the multisorbent method (method TNX) was used for the last 70 buildings studied. In addition, because the target VOC analyte list underwent some revision over the course of the BASE study, some analytes were sampled at fewer than the full 100 buildings. | ||||||
1% - 74% Building Frequency of Detection Indoors
| Analyte (Indoors) | Number of Buildings |
Building Frequency Detected Indoors (%) |
Analyte Concentration Indoors Percentile (ug/m3) |
Analyte Concentration Indoors Arithmetic Mean (ug/m3) |
||
|---|---|---|---|---|---|---|
| 5th | 50th | 95th | ||||
| Carbon Disulfide | 87 | 67 | ≤ LOQ | ≤ LOQ | 6.4 | 2.0 |
| Trichloroethene | 70 | 66 | ≤ LOQ | 0.29 | 2.6 | 0.76 |
| 3-Methyl Pentane | 70 | 64 | ≤ LOQ | 1.4 | 6.6 | 2.3 |
| 2-Methyl-1-Propanol | 13 | 31 | ≤ LOQ | ≤ LOQ | 5.3 | 1.4 |
| Chloroform | 87 | 29 | ≤ LOQ | ≤ LOQ | 1.3 | 0.59 |
| t-Butyl Methyl Ether | 70 | 24 | ≤ LOQ | ≤ LOQ | 14 | 2.8 |
| n-Heptanal | 13 | 23 | ≤ LOQ | ≤ LOQ | 2.0 | 2.1 |
| Trichlorotrifluoroethane | 87 | 21 | ≤ LOQ | ≤ LOQ | 8.1 | 2.3 |
| Dimethyl Disulfide | 87 | 14 | ≤ LOQ | ≤ LOQ | 3.6 | 2.6 |
| Chlorobenzene | 70 | 13 | ≤ LOQ | ≤ LOQ | 0.26 | 0.18 |
| Carbon Tetrachloride | 70 | 8.6 | ≤ LOQ | ≤ LOQ | 0.74 | 0.93 |
| 4-Phenylcyclohexene | 41 | 7.3 | ≤ LOQ | ≤ LOQ | ≤ LOQ | 0.17 |
| Bromomethane | 87 | 6.9 | ≤ LOQ | ≤ LOQ | 0.12 | 0.85 |
| 1,2-Dichloroethane | 87 | 4.6 | ≤ LOQ | ≤ LOQ | ≤ LOQ | 1.1 |
| 1,2,4-Trichlorobenzene | 29 | 3.5 | ≤ LOQ | ≤ LOQ | ≤ LOQ | 0.38 |
| Chloroethane | 87 | 3.5 | ≤ LOQ | ≤ LOQ | 1.4 | |
| 1,2-Dichlorobenzene | 70 | 2.9 | ≤ LOQ | ≤ LOQ | ≤ LOQ | 0.27 |
| Vinyl Chloride | 87 | 1.2 | ≤ LOQ | ≤ LOQ | ≤ LOQ | 0.78 |
| 1,2-Dibromoethane | 87 | 1.2 | ≤ LOQ | ≤ LOQ | ≤ LOQ | 1.1 |
| Note: Time-integrated air sampling for VOCs was collected in all 100 study buildings. The SUMMA canister method (method CAN) and aldehyde sample method (method ALD) were used in all 100 buildings, while the multisorbent method (method TNX) was used for the last 70 buildings studied. In addition, because the target VOC analyte list underwent some revision over the course of the BASE study, some analytes were sampled at fewer than the full 100 buildings. | ||||||
Not Detected in BASE Study Buildings Indoors
| Analyte (Indoors) | Number of Buildings |
Building Frequency Detected Indoors (%) |
Analyte Concentration Indoors Percentile (ug/m3) |
Analyte Concentration Indoors Arithmetic Mean (ug/m3) |
||
|---|---|---|---|---|---|---|
| 5th | 50th | 95th | ||||
| 1,1-Dichloroethane | 46 | - | ≤ LOQ | ≤ LOQ | ≤ LOQ | - |
| 1,1-Dichloroethene | 46 | - | ≤ LOQ | ≤ LOQ | ≤ LOQ | - |
| 1,3-Butadiene | 13 | - | ≤ LOQ | ≤ LOQ | ≤ LOQ | - |
| Butylated Hydroxytoluene | 41 | - | ≤ LOQ | ≤ LOQ | ≤ LOQ | - |
| cis-1,3-Dicholorpropene | 46 | - | ≤ LOQ | ≤ LOQ | ≤ LOQ | - |
| Dichlorotetrafluoroethane | 46 | - | ≤ LOQ | ≤ LOQ | ≤ LOQ | - |
| trans-1,3-Dichloropropene | 46 | - | ≤ LOQ | ≤ LOQ | ≤ LOQ | - |
| Note: Time-integrated air sampling for VOCs was collected in all 100 study buildings. The SUMMA canister method (method CAN) and aldehyde sample method (method ALD) were used in all 100 buildings, while the multisorbent method (method TNX) was used for the last 70 buildings studied. In addition, because the target VOC analyte list underwent some revision over the course of the BASE study, some analytes were sampled at fewer than the full 100 buildings. | ||||||