Visualize Your Water Challenge Winners
In January 2016 EPA, in collaboration with U.S. Geological Survey and several regional partners, launched Visualize Your Water Exit which challenged high school students in the Great Lakes Basin and Chesapeake Bay Watershed states to create innovative visualizations of nutrient data using open government data sources.
On April 21, 2016 the winners of this competition were announced Exit at an event at Washington-Lee High School in Arlington, Va.
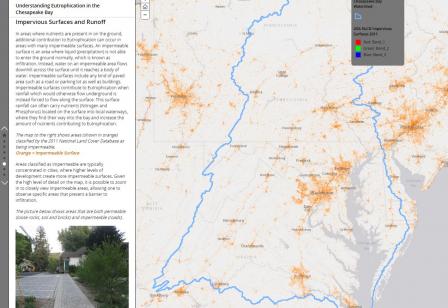
National Grand Prize – Nicholas Oliveira Understanding Eutrophication in the Chesapeake Bay Exit (Washington-Lee High School in Arlington, Va.)
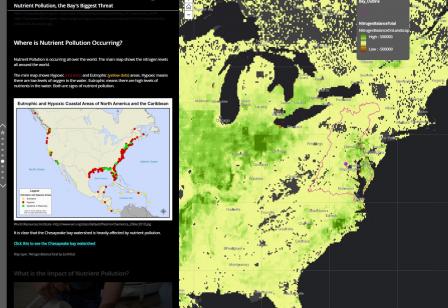
Chesapeake Bay Regional Prize – Alex Jin Nutrient Pollution, the Bay’s Biggest Threat Exit (Poolesville High School in Poolesville, Md.)
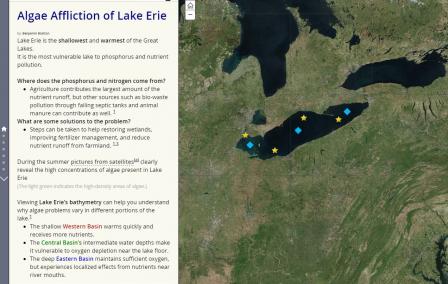
Great Lakes Regional Prize – Ben Bratton Algae Affliction of Lake Erie Exit (Father Gabriel Richard High School in Ann Arbor, Mich.)
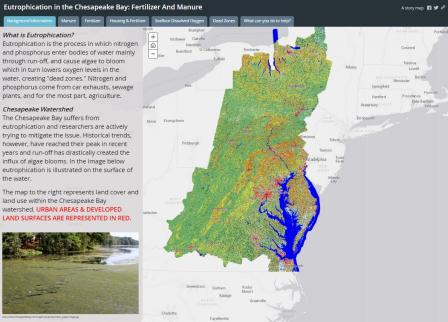
National Geographic Prize* – Anna Lujan Eutrophication in the Chesapeake Bay: Fertilizer and Manure Exit (Washington-Lee High School in Arlington, Va.)
*Award was selected and presented by National Geographic, in collaboration with the Visualize Your Water Challenge.
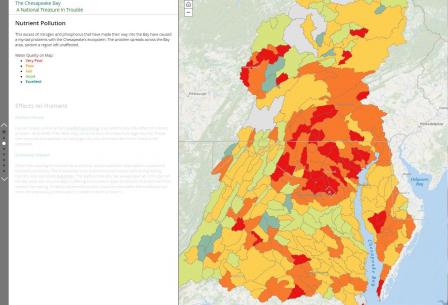
Honorable Mention – Clara Benadon The Chesapeake Bay: A National Treasure in Trouble Exit (Poolesville High School in Poolesville, Md.)
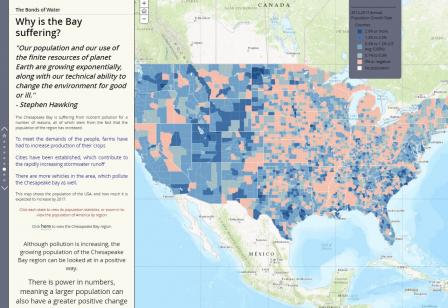
Honorable Mention – Sam Hull The Bonds of Water Exit(Poolesville High School in Poolesville, Md.)