Hypoxia 101
What is hypoxia and what causes it?
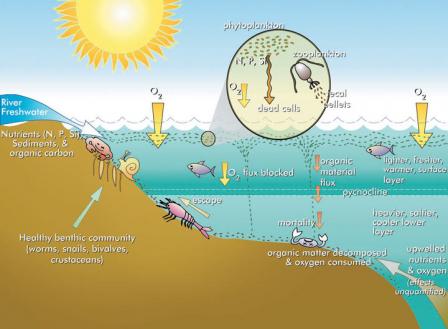
Hypoxia means low oxygen and is primarily a problem for estuaries and coastal waters. Hypoxic waters have dissolved oxygen concentrations of less than 2-3 mg/L. Hypoxia can be caused by a variety of factors, including excess nutrients, primarily nitrogen and phosphorus, and waterbody stratification (layering) due to saline or temperature gradients. These excess nutrients can promote algal overgrowth and lead to eutrophication. As dead algae decompose, oxygen is consumed in the process, resulting in low levels of oxygen in the water.
Nutrients can come from many sources, including any of the following:
- Fertilizers from agriculture, golf courses, and suburban lawns
- Erosion of soil full of nutrients
- Discharges from sewage treatment plants
- Deposition of atmospheric nitrogen
The hypoxic zone in the Gulf of Mexico forms every summer and is a result of excess nutrients from the Mississippi/Atchafalaya River and seasonal stratification (layering) of waters in the Gulf. As nutrient-laden water from the Mississippi flows into the Gulf, this freshwater is less dense and remains above the denser saline seawater. In addition to the saline gradient caused where the freshwater and saline water meet, the freshwater is warmer than the deeper ocean water, further contributing to the stratification. This stratification prevents the mixing of oxygen-rich surface water with oxygen-poor water on the bottom of the Gulf. Without mixing, oxygen in the bottom water is limited and the hypoxic condition remains.
Visit the Gulf of Mexico Dead Zone siteExit, developed by the Science Museum of MinnesotaExit.
Why is it important to reduce hypoxic zones?
Direct effects of hypoxia include fish kills, which deplete valuable fisheries and disrupt ecosystems. Mobile animals (e.g., adult fish) can typically survive a hypoxic event by moving to waters with more oxygen. Less mobile or immobile animals, such as mussels or crabs, cannot move to waters with more oxygen and are often killed during hypoxic events. Ultimately, hypoxia causes a severe decrease in the amount of life in hypoxia zones. Hypoxia also affects the ability of young fish or shellfish to find the food and habitat necessary to become adults. As a result, fish and shellfish stocks may be reduced or become less stable because less young reach adulthood. Hypoxia can also affect species that rely on fish for food. Such species might have to leave an area to find the necessary food to survive.
Where does hypoxia occur?
Hypoxia occurs naturally in many aquatic environments throughout the world, such as in deep basins in the ocean. Hypoxic waters have occurred throughout history, but they are occurring in shallow coastal and estuarine waters more frequently as anthropogenic (i.e. human) sources and inputs of nutrients increase.
The Gulf of Mexico hypoxic zone is located in the northern Gulf of Mexico off the coast of Louisiana and Texas. The zone was first documented in 1972. Learn more about the annual size and location of the Gulf of Mexico hypoxic zone since 2001. Hypoxia occurs in many places throughout the world. See the Hypoxia Research Team at the Louisiana Universities Marine Consortium website for more informationExit.
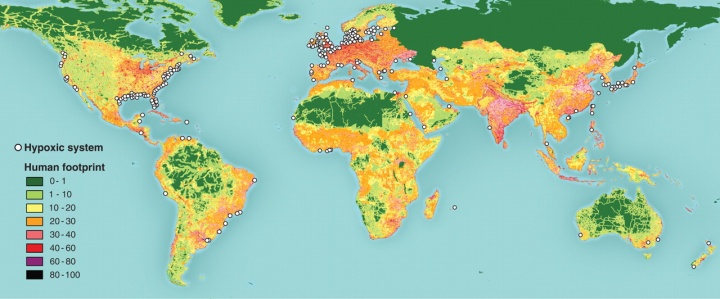
A study published in Science found that there are over 400 hypoxic zones in the world (Diaz and Rosenberg, 2008Exit). The hypoxic zone in the Gulf of Mexico is the largest in the United States, and one of the largest globally.
Dead zones worldwide; Figure from Diaz and Rosenberg, 2008Exit
- Read "Spreading Dead Zones and Consequences for Marine Ecosystems" Diaz and Rosenberg, Science, 2008Exit
- See supporting data from "Spreading Dead Zones and Consequences for Marine Ecosystems" Diaz and Rosenberg, Science, 2008Exit
NASA has mapped the locations of aquatic dead zones, showing relative dead zone size (areal extent in km2), along with population density (persons/km2) and particulate organic carbon (mg/m3). Darker blues in this image show higher concentrations of particulate organic matter, an indication of the overly fertile waters that can culminate in dead zones.


