Northern Gulf of Mexico Hypoxic Zone
2020 Gulf of Mexico Hypoxic Zone Size
The 2020 Gulf of Mexico hypoxic zone or "dead zone" measured 2,116 square miles and was the 3rd smallest in the 34-year record of surveys. The 5-year average is now down to 5,408 square miles. The earlier forecast for the dead zone was higher at 6,700 square miles. A major factor for the smaller measured size was due to extensive mixing caused by hurricane Hanna, which passed through the Gulf right ahead of the survey cruise. For more information, see the Lousiana Universities Marine Consortium (LUMCON) Exitand the National Oceanic and Atmospheric Administration (NOAA) Exit press releases.  Map of measured Gulf hypoxia zone, July-August 2020. (LUMCON/NOAA)
2020 Forecast: Summer Hypoxic Zone Size, Northern Gulf of Mexico
NOAA and the United States Geological Survey (USGS) released their summer hypoxia zone size in the Northern Gulf of Mexico on June 3, 2020. Read the full press release here. Exit Scientists are forecasting this summer’s Gulf of Mexico hypoxic area or “dead zone” – an area of low to no oxygen that can kill fish and other marine life – to be approximately 6,700 square miles, larger than the long-term average measured size of 5,387 square miles but substantially less than the record of 8,776 square miles set in 2017. The annual prediction is based on U.S. Geological Survey river-flow and nutrient data.
2019 Gulf of Mexico Hypoxic Zone Size
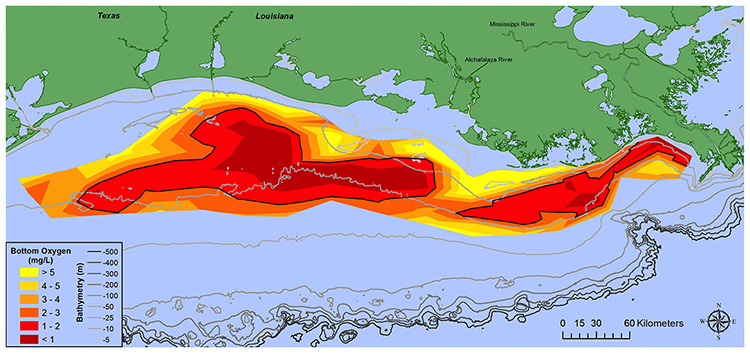 Distribution of bottom-water dissolved oxygen, July 22-July 31, 2019. Black line denotes 2 mg/L. Data source: N.N. Rabalais, Louisiana State University & Louisiana Universities Marine Consortium; R.E. Turner, Louisiana State University. Funding source: NOAAThe 2019 Gulf of Mexico hypoxic zone or “dead zone” measured 18,005 square kilometers (6,952 square miles), the eighth largest area mapped since 1985. It is slightly smaller than the 20,277 square kilometers forecasted by NOAA Exit in June 2019 and larger than the Hypoxia Task Force Goal of 5,000 square kilometers. Researchers found that Hurricane Barry’s arrival prior to measuring the zone helped mix the water column, but it only temporarily disrupted the already formed hypoxic zone. For more information, see the Louisiana Universities Marine Consortium (LUMCON) Exitand the National Oceanic and Atmospheric Administration (NOAA) Exitpress releases.
2019 Forecast: Summer Hypoxic Zone Size, Northern Gulf of Mexico
NOAA and the United States Geological Survey (USGS) released their 2019 forecast for the summer hypoxic zone size in the Northern Gulf of Mexico on June 10, 2019. Read the full press release. EXIT Scientists are expecting the 2019 area of low oxygen, commonly known as the 'Dead Zone,' to be approximately 7,829 square miles, or about the size of Massachusetts. This prediction is large primarily because of high spring rainfall and river discharge into Gulf.
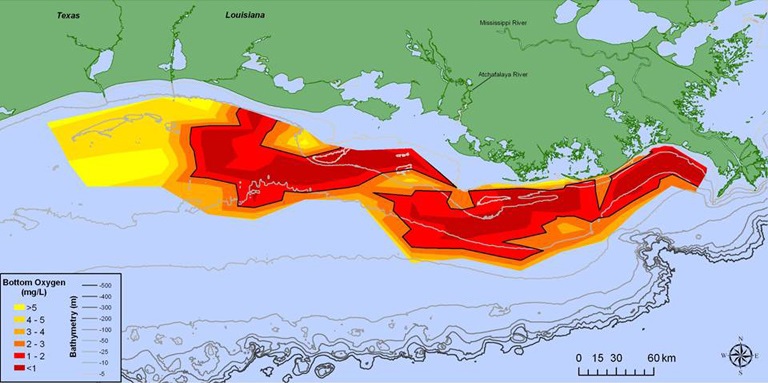
2018 Gulf of Mexico Hypoxic Zone Size Distribution of bottom-water dissolved oxygen, July 23-July 30, 2018. Black line denotes 2 mg/L. Data source: N.N. Rabalais, Louisiana State University & Louisiana Universities Marine Consortium; R.E. Turner, Louisiana State University. Funding source: NOAA

The 2018 Gulf of Mexico hypoxic zone or “dead zone” measured 7,040 square kilometers (2,720 square miles), the fourth smallest area mapped since 1985. It is considerably smaller than the 14,970 square kilometers forecasted by NOAA Exit in June 2018, yet still larger than the Hypoxia Task Force Goal of 5,000 square kilometers. Researchers suggest that persistently strong westerly winds and waves likely led to enhanced mixing conditions and smaller-than-expected zone size. For more information, see the Louisiana Universities Marine Consortium (LUMCON) Exitand the National Oceanic and Atmospheric Administration (NOAA) Exitpress releases.
2017 Gulf of Mexico Hypoxic Zone Size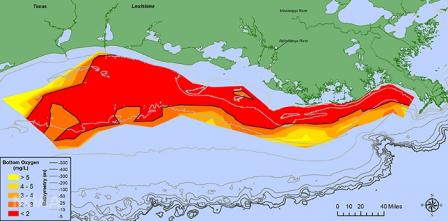 Distribution of bottom-water dissolved oxygen, July 24-July 30, 2017. Black line denotes 2 mg/L. Data source: N.N. Rabalais, Louisiana State University & Louisiana Universities Marine Consortium; R.E. Turner, Louisiana State University. Funding source: NOAA

The 2017 “Dead Zone” measured 22,720 square kilometers (8,776 square miles). This size is close to the forecast made in June. Researchers suggest that the Mississippi River May discharge, which was well above average, provides an explanation for most of the large zone measurement. For more information, read the Louisiana Universities Marine Consortium (LUMCON)Exit and the National Oceanic and Atmospheric Administration (NOAA)Exitpress releases.
2016 Cruise to Measure Gulf of Mexico Hypoxic Zone Size Cancelled
Due to mechanical problems with the NOAA ship designated for the measurement cruise, the hypoxic zone was not measured in 2016. Read the full press release for more informationExit.
2015 Gulf of Mexico Hypoxic Zone Size
 Distribution of bottom-water dissolved oxygen July 28-August 3, 2015. Black line indicates dissolved oxygen level of 2 mg/L. Data source: N.N. Rabalais, LUMCON, and R.E. Turner, LSU. Funding sources: NOAA and U.S. EPA
The 2015 “Dead Zone” measured 16,760 square kilometers (6,474 square miles). This size is larger than the predicted range made in June. Researchers suggest that heavy rains in June and high river discharges in July may provide an explanation for the larger zone measurement. Read the Louisiana Universities Marine Consortium (LUMCON)Exit and the National Oceanic and Atmospheric Administration (NOAA)Exitpress releases.
2014 Gulf of Mexico Hypoxic Zone Size
 Distribution of bottom-water dissolved oxygen July 27-August 1, 2014. Black line indicates dissolved oxygen level of 2 mg/L. Data source: N.N. Rabalais, LUMCON, and R.E. Turner, LSU. Funding sources: NOAA and U.S. EPA

The 2014 "Dead Zone" measured 13,080 square kilometers (5,052 square miles) as of August 1, 2014. This size fell within the predicted range made in June. Read the LUMCON press releaseExit and the NOAA press release.Exit
Measuring the Hypoxic Zone
The hypoxic zone in the northern Gulf of Mexico is an area along the Louisiana-Texas coast, where water near the bottom of the Gulf contains less than two parts per million of dissolved oxygen, causing a condition referred to as hypoxia.
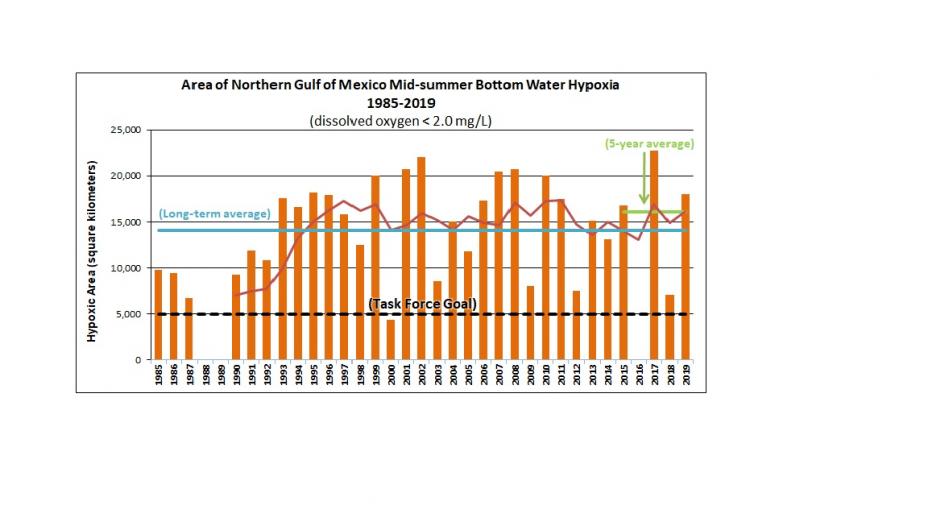
Each summer, the size of the hypoxic zone is measured. The size of the zone is an important indicator of how much progress is being made to reduce nutrient inputs into the Gulf of Mexico. Sometimes the size of the zone is influenced by other factors, such as droughts or hurricanes that can reduce the size of the zone, or floods that can increase the size.
 Data source: Nancy N. Rabalais, LUMCON, and R. Eugene Turner, LSU
Information about the size of the hypoxic zone can be obtained from NOAA’s Gulf of Mexico Hypoxia WatchExit and the LUMCONExit, which is supported by NOAA’s NGOMEX.Exit
The Gulf of Mexico Hypoxia WatchExit evolved as a cooperative project among NOAA’s National Marine Fisheries Service (NMFS), the National Coastal Data Development Center (NCDDC), and the CoastWatch - Caribbean/Gulf of Mexico - Regional Node. The objective of Hypoxia Watch is to develop new near-real time data and map products using shipboard measurements of bottom-dissolved oxygen and disseminate them over the Internet. Access measurements taken from 2001 to the current season.Exit