2019 Mystic River Watershed Report Card Frequently Asked Questions
- Why is a grade issued for segments of the Mystic River watershed?
- What are the grades for the 2019 calendar year?
- What data are the grades based upon?
- How are the grades calculated?
- If it rains a lot will the grade be worse?
- What affect does the "rolling average" have on the grade?
- Why was water quality in a number of Mystic River Watershed tributaries poor during the 2019 calendar year?
- What is being done to improve water quality in the Mystic River Watershed?
- Why don't you use other parameters besides bacteria?
- What is the difference between the Mystic River Report Card grade and a similar grade issued for the Charles River?
- What sections of the Mystic Watershed are better than others?
Why is a grade issued for segments of the Mystic River watershed?
Analysis of the data each year has brought to light the fact that water quality in the main stem of the Mystic River, including the Upper and Lower Mystic Lakes, is quite good on a regular basis. On the other hand, water quality in many of the urban tributary streams in the Mystic River watershed is often poor. Grading the watershed by segments provides the public a more accurate assessment of local water quality conditions and greater transparency for all stakeholders. It also allows the Mystic River Watershed Association ("MyRWA") and the regulatory agencies to focus efforts where they are most needed to bring about a positive change. A grade for each year is calculated in the same manner as in the past; however, the current year’s grade is averaged with the prior two years to produce the "rolling" three-year average. Such a system allows for a more complete and accurate assessment of recent water quality and is designed to better address climate variability from year to year, while allowing for real data trends to be more easily discerned.
What are the grades for the 2019 calendar year?
The grades for the 2019 calendar year range from those in the "A" and "A-" range for Chelsea River, the Upper Mystic Lake, the main stem of the Mystic River, to an "F" for Winns Brook portion of the watershed. It is important to note that while water quality in some of the tributary streams is poor, the water quality in the main stem of the freshwater portion of the Mystic River, from the Mystic Lakes, through Medford Square, and down to the Amelia Earhart Dam, has consistently been very good.
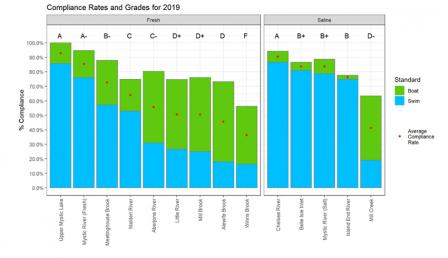 View a larger version of this image.
Figure 1 - Developed and provided by MyRWA.
What data are the grades based upon?
The Mystic River Watershed Annual Report Card grades are based upon water quality data provided by MyRWA's baseline monitoring program, as well as data collected by the Massachusetts Water Resources Authority ("MWRA"). Each month, a group of trained MyRWA volunteers in the Mystic Monitoring Network (MMN) gather water quality samples from fifteen representative sites throughout the watershed. These samples are sent to a laboratory and analyzed for bacteria, nutrients and other valuable indicators. MyRWA staff assesses the data for quality assurance and make the information available to any interested party. The annual grade is a measure of how frequently bacteria levels in these samples meet the state water quality standards for boating and swimming. In addition, The MWRA collects water quality samples as part of multiple programs throughout the watershed. The inclusion of approximately 19 MWRA locations is a key part of the expanded grading program. The MyRWA and MWRA data are compared to State standards. The Commonwealth of Massachusetts has standards of 235 and 1260 E. coli per 100 ml of water as acceptable levels for swimming and boating, respectively, in fresh water, and standards of 104 and 350 enterococci per 100 ml of water as acceptable levels for swimming and boating, respectively, in salt water.
How are the grades calculated?
The grades are calculated based on the percentage of days during dry and wet weather that bacteria levels at each of the sampling sites meet Massachusetts Department of Environmental Protection (MA DEP) water quality standards for swimming and boating. An average between the overall percentages that water quality met criteria for swimming and boating for each location is calculated. The current year's percentage is averaged with the prior two years to produce the "rolling" three-year average. This average percentage is compared to the scale below and the appropriate grade assigned:
| Grade | Compliance with Water Quality Standards |
|---|---|
| A+ | 95% to 100% |
| A | 90% to 95% |
| A- | 85% to 90% |
| B+ | 80% to 85% |
| B | 75% to 80% |
| B- | 70% to 75% |
| C+ | 65% to 70% |
| C | 60% to 65% |
| C- | 55% to 60% |
| D+ | 50% to 55% |
| D | 45% to 50% |
| D- | 40% to 45% |
| F | less than 40% |
If it rains a lot will the grade be worse?
Because the Mystic Monitoring Network (MMN) samples and MWRA samples are collected on set days regardless of the weather, we cannot predict how many samples will be taken in dry or wet weather each year. To calculate the grade, EPA normalizes the data to control for wet weather by giving dry weather sample results more weight in the overall grade (75% dry weather/25% wet weather). These percentages are based upon weather conditions seen during the first year EPA calculated a report card for the Mystic River Watershed, and by normalizing in this way we are able to standardize the grade for year-to-year comparison. It is true that the water quality is impaired more frequently during wet weather conditions than dry conditions. If our calculations did not control for the frequency of wet and dry weather, we would see greater variability in the grade on a yearly basis that would mask any trends in water quality. In addition, the use of a 3-year rolling average is specifically designed to better address climate variability from year to year, while allowing for real data trends to be more easily discerned.
What affect does the "rolling average" have on the grade?
A "rolling" average is frequently used with data sets that vary from measurement to measurement. The use of the 3-year rolling average limits the effect that a very good or very bad year can have on the overall data trend, and thus prevents the grade from varying significantly from year to year, while at the same time allowing trends in the data to be more readily apparent.
Why was water quality in a number of Mystic River Watershed tributaries poor during the 2019 calendar year?
Water quality is directly affected by stormwater runoff, illicit connections, as well as Combined Sewer Overflows (CSOs) and Sanitary Sewer Overflows (SSOs) that occur during large precipitation events. Monthly data continues to highlight a number of locations in the watershed with poor water quality in both wet and dry weather. Known or suspected illicit discharges are actively being investigated in these areas. EPA continues to work with MyRWA, municipalities, and the state to further analyze the data and take appropriate actions where necessary. While investigative work to date has identified a number of causes of poor water quality, further investigation and the design and construction of remedial measures takes time (months to years) before improvements in the receiving waters can be documented. Since 2005, EPA enforcement actions have caused in excess of 43,000 gallons of sewage per day to be removed from the storm drain system. A number of additional repairs have been made that have prevented tens of thousands of gallons of sewage from discharging to the river during rain events.
What is being done to improve water quality in the Mystic River Watershed?
Municipalities throughout the watershed are examining their stormwater systems and related discharges for areas to make improvements. These communities are working to upgrade aging infrastructure and reduce the flow of sewage into surface water bodies. EPA recently re-issued the stormwater general permit that applies to many municipalities throughout Massachusetts, including all of the communities within the Mystic River watershed. This general permit went into effect on July 1, 2018 and will make a significant improvement in how stormwater is handled and discharged to receiving waters, and is designed to make significant improvements in water quality throughout the state.
In the Alewife area, the MWRA and the City of Cambridge completed a large constructed wetland/park/detention basin as part of the EPA-approved Boston Harbor Long Term Control Plan ("LTCP"). The constructed wetland addresses increased stormwater that Cambridge is removing from its sanitary sewers, which will cause a significant reduction in the CSO volume discharged to the Alewife Brook. While all of the remedial projects required by the LTCP have been completed, several communities continue to make additional improvements that will further benefit the Mystic watershed.
At the same time, the science and water quality subcommittees under the Mystic River Watershed Initiative Steering Committee are working to improve water quality in the Mystic River Watershed. The science subcommittee coordinates water monitoring needs, while the water quality working group has identified specific priorities and actions they would like to collaboratively tackle over the next few years including reducing SSOs, offering technical assistance to municipalities, reducing nutrient loading, and remediating legacy pollution.
Finally, EPA and MA DEP have issued enforcement orders to several municipalities in the Mystic River Watershed requiring them to identify and remediate SSOs and illicit connections that discharge raw sewage to the watershed. Since 2005, these actions have removed in excess of 43,000 gallons per day of sewage from storm drains discharging to the Mystic River (that is over 15 million gallons per year). A number of identified illicit connections are being repaired right now, and EPA anticipates a continued increase in the volume of sewage removed from the watershed over the next several years. Additional investigations will continue and EPA and MA DEP will take any appropriate actions as new data and information become available.
Why don't you use other parameters besides bacteria?
The Mystic River Watershed grade was developed to easily communicate how frequently water quality meets criteria that are acceptable for recreation (e.g. swimming and boating). There has been a lot of research done to identify a relationship between high bacteria levels and public health risk of illness during recreation in contaminated waters. While other parameters are important for the health of the ecosystem (e.g. nutrients, TSS) they are not as easily correlated with human health. The Mystic River Watershed grade provides a snapshot of one aspect of water quality.
In addition to bacterial contamination, the Mystic River watershed also suffers from excess nutrients, primarily phosphorus, entering the river from stormwater. Starting in 2016, EPA, MassDEP, and MyRWA worked with watershed stakeholders and technical experts to develop a study of nutrient-related water quality impairments and necessary pollutant load reductions to achieve water quality goals in the Mystic River watershed. The recently completed Mystic River Watershed Alternative TMDL Report identifies stormwater runoff as the primary source of phosphorus in the watershed and provides estimates of the phosphorus load reductions necessary to attain Massachusetts Surface Water Quality Standards and restore designated uses including swimming, boating, and fishing. This report can be found at the following link: https://19january2021snapshot.epa.gov/mysticriver/environmental-challenges-mystic-river-watershed#NutrientChallenges
What is the difference between the Mystic River Report Card grade and a similar grade issued for the Charles River?
In past years, for the Charles River, monitoring samples collected in the middle of the river's main stem from the Watertown dam to the New Charles River dam in Boston were used for a single grade, whereas in the Mystic River Watershed, samples are taken throughout the entire watershed and often in the tributaries before they discharge into the main stem of the river. The Charles River Watershed Association is looking to broaden the scope of their annual report card – stay tuned for updates. Regardless of the method used to grade each watershed, it is important to note that the grades should not be compared against one another. However, these grades do provide a basis to track annual progress and water quality within each watershed.
What sections of the Mystic Watershed are better than others?
Water quality in the main stem of the Mystic River between the Route 16 Bridge and the confluence with the Inner Boston Harbor is quite good. Significant settling of pollutants can occur where the river widens and flow slows down, and this is generally reflected in the data collected in this area of the watershed. This is similar to what happens upstream in the Upper and Lower Mystic Lakes and in the Charles River basin to the south.