Mystic River Watershed Report Cards
EPA has been assigning a report card grade for the Mystic River Watershed since calendar year 2006. For the last five years, grades have been assigned to 14 individual stretches of the river and its tributaries. Prior to 2014, a single grade was assigned to the watershed as a whole.
Grading Criteria 2014-Present
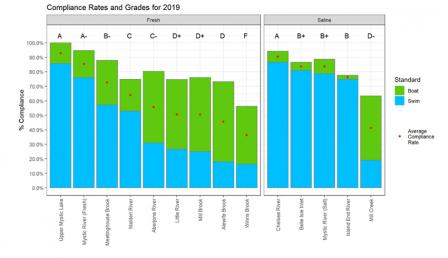
Since calendar year 2014, EPA, in coordination with the Mystic River Watershed Association (MyRWA), has utilized an enhanced, more locally-specific analysis of water quality in the Mystic River Watershed to better illuminate environmental conditions for the public. Instead of one grade for the entire watershed, EPA and MyRWA now issue grades for each segment of the watershed, totaling 14 separate stretches of river and its tributaries. The same grading system applies (see below), but now an average between the overall percentages that water quality met the state criteria for swimming and boating (for the Aberjona in 2016, it was 61.8%) as well as qualitative criteria that are similar to those developed for the Charles River Initiative (see below) are calculated for each segment to produce the grades shown here.
 View a larger version of this image.
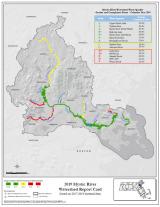
Figure 1 - Developed and provided by MyRWA.
| 2019 | 2018 | 2017 | 2016 | 2015 | 2014 | |||||||
|---|---|---|---|---|---|---|---|---|---|---|---|---|
| Sites | Grade | Total | Grade | Total | Grade | Total | Grade | Total | Grade | Total | Grade | Total |
| Aberjona River | C- | 55.7% | D+ | 52.6% | C- | 59.4% | C | 61.8% | C+ | 66% | C+ | 65% |
| Alewife Brook | D | 45.6% | D | 50.0% | D+ | 53.8% | D+ | 54.2% | D | 50% | D | 46% |
| Little River | D+ | 50.7% | D+ | 52.6% | D+ | 54.2% | D | 49.4% | D- | 44% | D- | 40% |
| Malden River | C | 63.9% | C | 60.1% | C | 63.7% | C+ | 65.1% | C | 63% | C- | 59% |
| Meetinghouse Brook | B- | 72.6% | B- | 71.9% | B | 78.4% | C+ | 66.5% | C- | 58% | D | 47% |
| Mill Brook | D+ | 50.5% | D | 49.4% | C- | 55.1% | D+ | 53.1% | D | 49% | D- | 46% |
| Mystic River (fresh) | A- | 85.5% | A- | 86.9% | A- | 87.6% | A- | 85.8% | A- | 85% | B+ | 85% |
| Upper Mystic Lake | A | 92.9% | A | 93.4% | A+ | 98.6% | A+ | 98.9% | A+ | 96% | A+ | 96% |
| Winns Brook | F | 36.3% | D- | 40.1% | F | 38.4% | D- | 42% | F | 33% | F | 33% |
| 2019 | 2018 | 2017 | 2016 | 2015 | 2014 | |||||||
|---|---|---|---|---|---|---|---|---|---|---|---|---|
| Sites | Grade | Total | Grade | Total | Grade | Total | Grade | Total | Grade | Total | Grade | Total |
| Belle Isle Inlet | B+ | 83.8% | A- | 86.0% | A- | 89.3% | A- | 85.7% | B | 78% | C | 64% |
| Chelsea River | A | 90.4% | A | 95.0% | A | 94.6% | A | 91.2% | A- | 90% | A- | 87% |
| Island End River | B | 76.3% | C+ | 66.7% | D- | 42.5% | F | 36.3% | F | 25% | F | 33% |
| Mill Creek | D- | 41.3% | F | 36.1% | F | 31.3% | F | 33.5% | F | 34% | F | 32% |
| Mystic River (salt) | B+ | 83.7% | A- | 86.0% | A- | 88.3% | A- | 87.6% | A- | 89% | A | 90% |
For more information on how the grades are assigned please read the Frequently Asked Questions and review the data on MyRWA's Website Exit.
Grading Criteria Prior to 2014
When assessing water quality to assign a grade to the Mystic River Watershed prior to 2014, EPA used an average between the overall percentages that water quality met the state criteria for swimming and boating (for 2013, it was 66%) as well as qualitative criteria that are similar to those developed for the Charles River Initiative, as follows:
A - met swimming and boating standards nearly all of the time
B - met swimming and boating standards most of the time
C - met swimming standards some of the time, and boating standards most of the time
D - met swimming and boating standards some of the time
F - fail swimming and boating standards most of the time
| Year | Grade | Overall* | Dry* | Wet* | |||
|---|---|---|---|---|---|---|---|
| Boating | Swimming | Boating | Swimming | Boating | Swimming | ||
| 2013 | D | 83% | 49% | 88% | 51% | 67% | 42% |
| 2012 | D | 75% | 47% | 84% | 58% | 45% | 14% |
| 2011 | D | 87% | 46% | 93% | 54% | 69% | 25% |
| 2010 | D- | 70% | 28% | 72% | 26% | 63% | 33% |
| 2009 | C- | 93% | 57% | 93% | 51% | 90% | 75% |
| 2008 | C- | 90% | 59% | 93% | 64% | 81% | 43% |
| 2007 | D | 68% | 46% | 63% | 45% | 83% | 50% |
| 2006 | D | 80% | 52% | 93% | 59% | 41% | 30% |
| 2005** | 85% | 56% | 90% | 64% | 69% | 31% | |
| 2004** | 79% | 52% | 85% | 59% | 61% | 59% | |
| 2003** | 81% | 55% | 81% | 53% | 81% | 62% | |
| *Figures represent the percentage of time that state bacterial standards are met. **The Mystic River Watershed did not receive formal grades for the years 2003 - 2005. |
|||||||
Mystic River in the News
- 08/13/2020
Annual Report Card Indicates Improving Bacterial Water Quality in the Mystic River in 2019 - 06/26/2019
Annual Report Card Shows Good Water Quality in Main Stem of the Mystic River in 2018 - 06/13/2018
Annual Report Card Shows Water Quality Improvements in Parts of the Mystic River Watershed in 2017 - 06/29/2017
Annual Report Card Shows Water Quality Improvements in Parts of the Mystic River Watershed - 05/31/2016
Localized Mystic River Report Card Shows Specific Information about Water Quality - 07/18/2015
New Grading System for Mystic River Watershed Gives Public Better Localized Information - 12/18/2014
EPA Announces 2013 Report Card Grade for the Mystic River Watershed - 08/19/2014
EPA Awards $120,000 in Urban Waters grants to Revitalize Mystic River Watershed - 08/07/2013
EPA Announces 2012 Report Card grades for the lower Charles River and the Mystic River Watershed - 05/10/2013
Federal Agencies Expand Urban Waterway Revitalization Efforts in Communities Across the Nation - 08/23/2012
Settlement Requires Boston Water and Sewer Commission to Remedy Sewer and Stormwater Discharges - 08/22/2012
Clean Water Act Settlement Ensures That Boston Racetrack Addresses Wastewater and Stormwater Discharges - 05/20/2012
Mystic River Water Quality Receives a "D" - Ongoing efforts, analysis highlight problem areas - 10/14/2011
ExxonMobil Addresses Stormwater at Everett Terminal – Better Water Quality in Mystic and Island End Rivers Will Result - 05/15/2011
Mystic River Water Quality Score Downgraded to D- Despite ongoing efforts, analysis shows more work needed - 05/16/2010
Mystic River Scores C- : Good Progress Underway - 05/02/2009
Report Card for Mystic River: "C-" with Notable Improvement - 10/17/2008
Equipment Loans Help New England Volunteers Collect Water Quality Info - 5/15/2008
Suffolk Downs Race Course Ordered to Reduce Bacterial Waste in Stormwater - 04/10/2008
EPA Mystic River Report Card: "D" – Room for Improvement – Help Is On the Way - 04/17/2007
EPA Kicks Off Major Effort to Improve Conditions of Mystic River Watershed - 02/26/2007
Everett, Mass. Metal Finisher Fined and Settles Environmental Violations - 10/30/2006
Massachusetts Celebrates World Water Monitoring Day - 07/12/2006
Mass. Recycling Facility Facing Fines for Clean Water Violations - 03/10/2004
$1.4 Million Environmental Settlement With MBTA Brings Clean Air and Water Benefits to Boston: Settlement Stems from Bus Idling and Water Pollution Violations - 12/03/2001
EPA Awards $363,257 Grant to Somerville for Mystic River Project