National Coastal Condition Assessment Change in Condition
Among the long-term goals of the NARS is detecting trends over time in the condition of U.S. waters and in the stressors that affect them. This information can help policymakers evaluate the effectiveness of national and regional programs and policies, and can allow them to determine whether different approaches are needed to meet water quality goals.
For the National Coastal Condition Assessment (NCCA) 2010, analysts evaluate change in U.S. coastal condition using a comparable subset of data from each of three periods: 1999–2001, 2005–2006, and 2010. This change analysis looks at the Northeast, Southeast, Gulf, and West Coast regions. The Great Lakes are not included in the analysis because they were not surveyed using NARS protocols prior to 2010. Coastal areas not included in all three time periods are not included as part of the change estimates.
The 1999-2001 and 2005-2006 surveys were conducted as research projects under EPA’s Office of Research and Development. Starting in 2010, the National Coastal Condition Assessments are being implemented by EPA’s Office of Water and state partners under the National Aquatic Resource Surveys. Because of the changes in design from survey to survey, change estimates are calculated from only the comparable portion of each survey. This allows us to make comparisons between the reporting cycles. EPA’s plan starting with 2010 is for the populations to remain consistent.
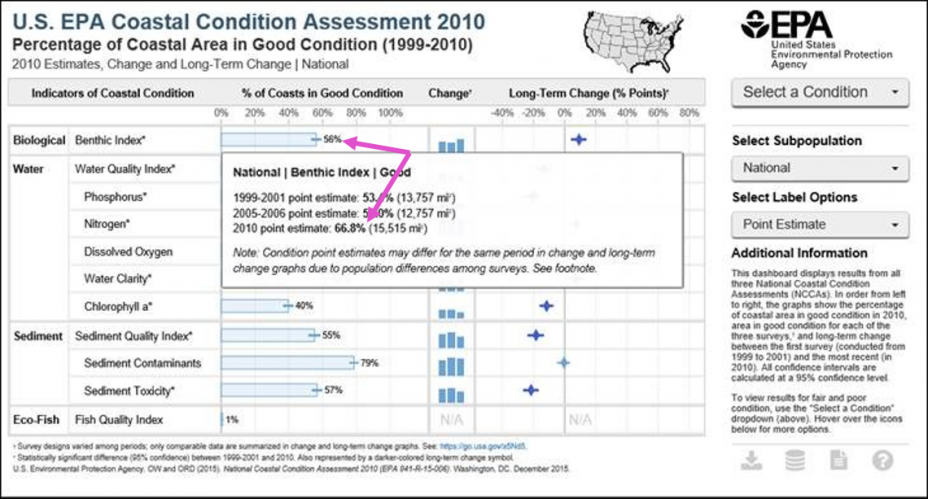
When exploring results in the NCCA data dashboard, the difference between the assessment from 2010 and coastal areas included in the change estimate can be seen in different point estimates reported in the “% of Coasts in Good [Fair or Poor] Condition” column and those reported in the “Change” column. As an example, in the following screenshot, when examining the “% of Coasts in Good Condition”, 56% of Coasts in the national population are estimated to be in Good Condition for the Benthic Index for the most recent survey (2010). However, when you review information from the “Change” column within the pop-out window, you’ll see that the 2010 estimate of the national population of coasts in good condition for the Benthic Index is 66.8%. This is because the change estimate is based on a smaller portion of the overall population that can be compared with those from 2005-2006 and 1999-2001.

