Regional Highlight - Mercury in Fish Tissue in the Pacific Northwest
In conjunction with the National Lakes Assessment 2012, a regional study of mercury in lake fish tissue was conducted in the Pacific Northwest (PNW) states of Idaho, Oregon and Washington. The objective of this study was to determine concentrations of mercury in recreational fish species in order to establish a baseline condition for the region.
Design and Methods
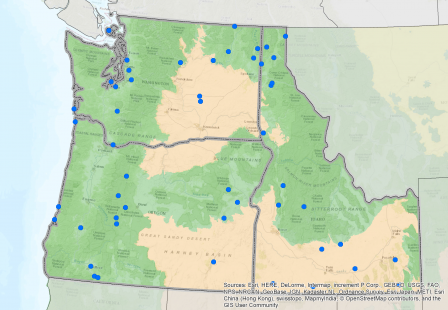
 Figure 1. Locations of the 50 sampled fishable lakes for the Pacific Northwest states shown in the Western Mountains (green) and Xeric (brown) NARS ecoregions.The lakes of interest for this mercury study were those used for fishing. The list of NLA sample lakes was restricted to a ‘fishable’ target population of lakes that have public access with ability to harvest fish legally, and contain at least one fish species known to be commonly consumed by anglers.
The final sample set of lakes consisted of 50 lakes (16 or 17 in each state) (Figure 1). Fish were collected from these lakes over three field seasons, from 2012 to 2014. Fish of 13 different species representing four fish families were used in the analysis. Most fish were either trout or bass. Fillet (muscle) tissue was analyzed for mercury (EPA method 7473). The arithmetic mean fish tissue mercury (Hg) value was calculated for each of the 50 lakes. Lake weights were used to calculate results for an inference population of 905 fishable lakes across the PNW.
Results
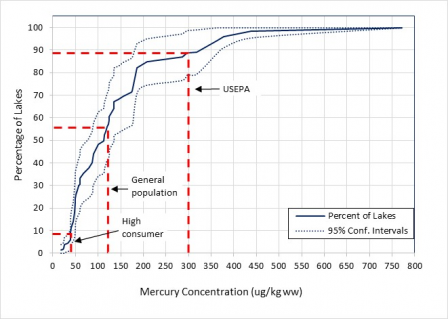
All of the fish samples had quantifiable levels of mercury. Concentrations (mean lake value) range from 18.2 to 771.0 ug kg-1 wet weight. The mean Hg concentration was 144.8 µg kg-1wet weight and the median value (50th percentile) was 112.3 µg kg-1wet weight. Results were compared to three mercury concentration screening values to provide perspective on the extent of mercury contamination in PNW lake sport fish:
- USEPA’s fish tissue methylmercury criterion to protect the health of individuals who eat fish (300 µg kg-1 wet weight).
- A ‘general population’ screening value (120 µg kg-1 wet weight). This is based on a consumption rate of about two fish meals per week, which is the amount recommended by the American Heart Association.
- A ‘high consumer’ screening value (40 µg kg-1 wet weight). This corresponds to the 2014 Oregon state fish tissue standard, which accounts for the portion of the population that eats more fish than average consumers, about 23 fish meals per month.
 Figure 2. Cumulative distribution frequency plot of fish tissue Hg by percent of lakes. Red dashed lines indicate the lake percentile corresponding to three screening values (inferred population = 905 lakes).
As shown in Figure 2, the USEPA human health screening criterion was exceeded in an estimated 11% of the fishable PNW lakes. The most stringent screening value representing high consumers was exceeded in 91% of the inference lakes.
Comparison to a Nationwide Baseline
Results of this study were compared to the 2000-03 nationwide study of contaminants in fish tissue. That study’s results were based on a probability sample of 500 lakes stratified by lake size. Mercury was analyzed from composite fillets using method USEPA1631. As with the PNW 2016 results, mercury was found to be ubiquitous nationwide, present in all predator samples. However, nationwide results had higher mercury concentrations than the PNW study. The EPA criterion was exceeded in 49% of the inference population of lakes in the national study, versus 11% in the PNW lakes.
