NEPmap User Guide
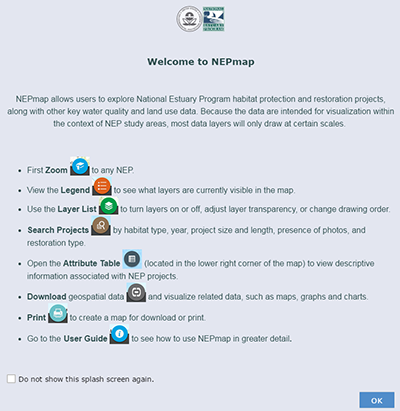
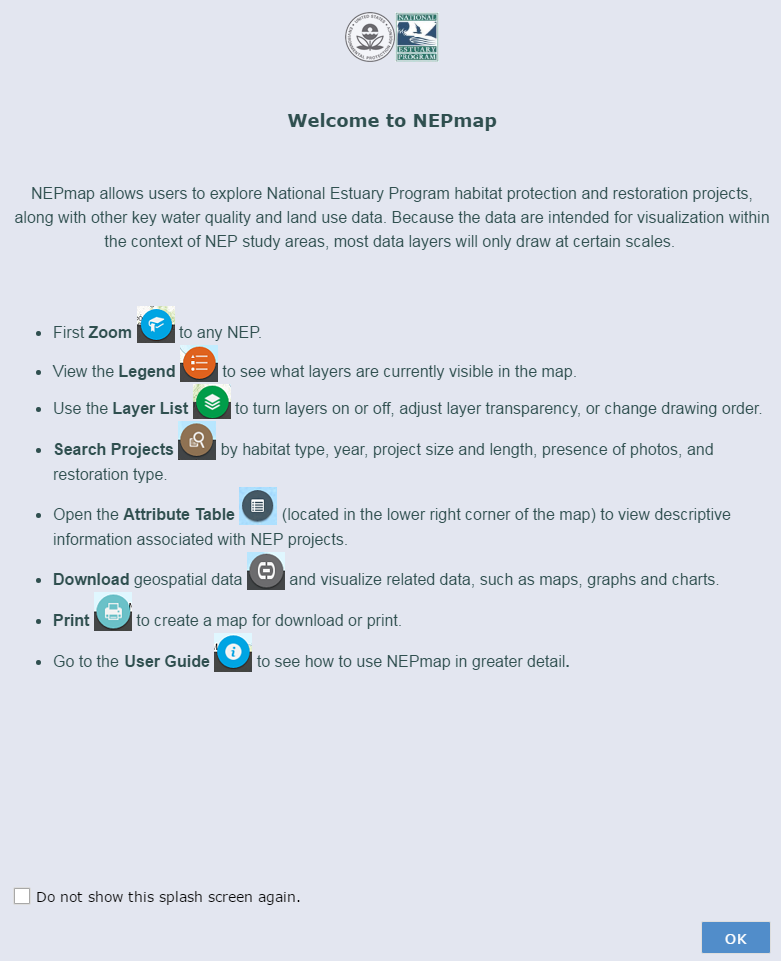
The NEPmap application offers numerous ways to interact with and explore NEP-related data. This guide shows how to use the navigation controls, widgets and other features included in the application.
Overview
- National Estuary Programs (NEPs) and their partners protect and restore estuarine habitat.
- NEPmap is an interactive web application that presents NEP habitat project data which is reported for EPA’s Strategic Plan.
- Viewers can see NEP habitat protect locations, photos, and project descriptions along with project size and lead implementer.
- The NEP habitat projects are presented along with other land use and water quality data layers within each NEP Study Area geographic boundary.
- NEPmap can be found at https://gispub.epa.gov/NEPmap/
What You Can Do Using NEPmap
NEPmap allows users to visualize and explore NEP project-related and ancillary data in a variety of ways. Users of NEPmap can:
- View spatial NEP project data in the context of relevant environmental data, such as streams, land use, marine protected areas and more. A complete list of available data is presented in the Available Layers section of this user guide.
- Access NEP descriptive data and the before, during and after photos of projects by simply clicking on an NEP project point in the map.
- Projects points with a "P" will contain photos.
- Filter NEP projects and export selected records for use in Excel, or repurpose selected records in their own web maps.
- Download select NEP and ancillary datasets.
- View NEP data pie charts and detailed water quality data.
- Create, save and print maps using any available map layers.
 View a larger version of this image.
This guide shows how to use the navigation controls, widgets and other features included in the application.
Navigation
Navigation in NEPmap is done using a combination of mouse functions and the zoom controls located in the upper left corner of the screen.
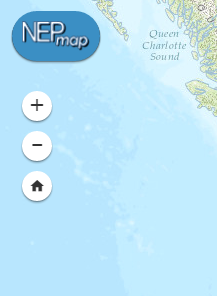
- Use the + key to zoom in
- Use the - key to zoom out
- Use the Home key to zoom back to the initial extent of the map
- Zoom to an area by holding the shift key and drawing a rectangle while holding the left mouse button
- Pan the map by holding the left mouse button and dragging the mouse in any direction
- Center the map on a location by holding the shift key and clicking a location on the map
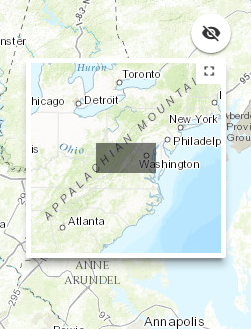
- An Overview Map can be toggled on and off by clicking the icon in the upper right corner of the screen
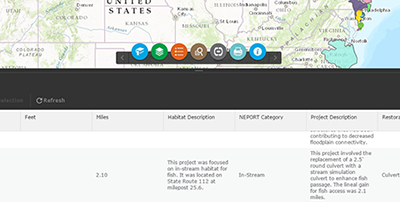
Popups
A popup is a window that displays descriptive information about features on the map. Popups are available for many layers in NEPmap and can be accessed by clicking on a feature in the map.
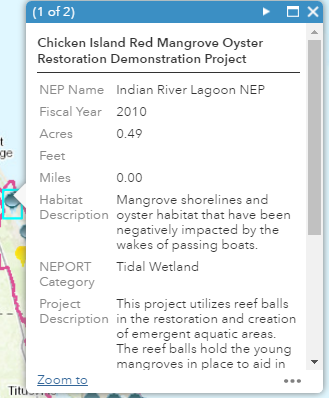
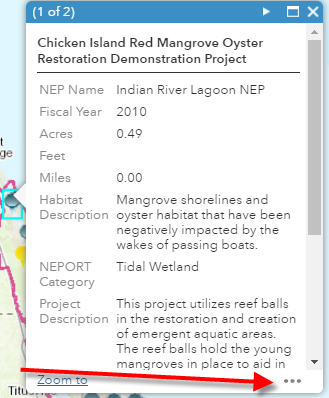
From within the popup window, you can zoom in closer to the selected feature by clicking Zoom to in the lower left corner.
You can center the feature on the map, or open its attribute table, by clicking the ellipsis in the lower right corner and selecting the appropriate option.
Widgets
There are two types of widgets in NEPmap: onscreen widgets and widgets in the anchor bar controller.
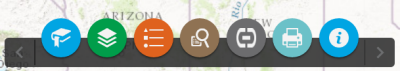
Widgets in the Anchor Bar Controller
The Anchor Bar Controller contains several widgets that are used to perform various functions on the map. Each widget can be opened by clicking on the widget icon in the controller. Once activated, widgets appear on top of the screen and can be resized and moved around the map. Widgets can be closed by clicking the widget icon on the controller or by clicking X in the upper right corner of the widget.
 View a larger version of this image.
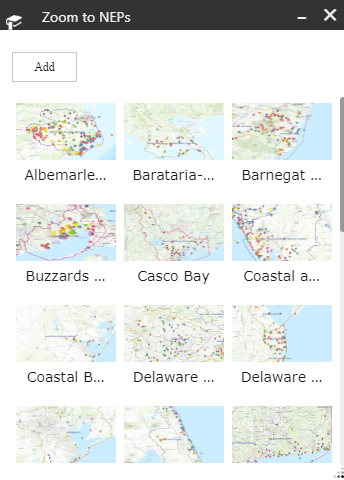
Bookmark Widget
The Bookmark (Zoom to NEPs) Widget provides a way for you to zoom directly to a predefined extent of an NEP program of interest. Clicking on any thumbnail image in this widget will zoom the map to the specified bookmark. You can delete existing bookmarks by highlighting the bookmark and clicking the Delete button. You can add new bookmarks by zooming into a desired map extent, entering a name and hitting the + sign.
Layer List Widget
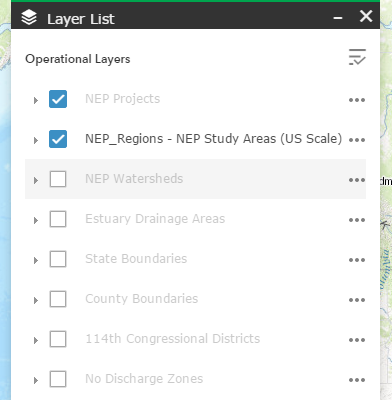
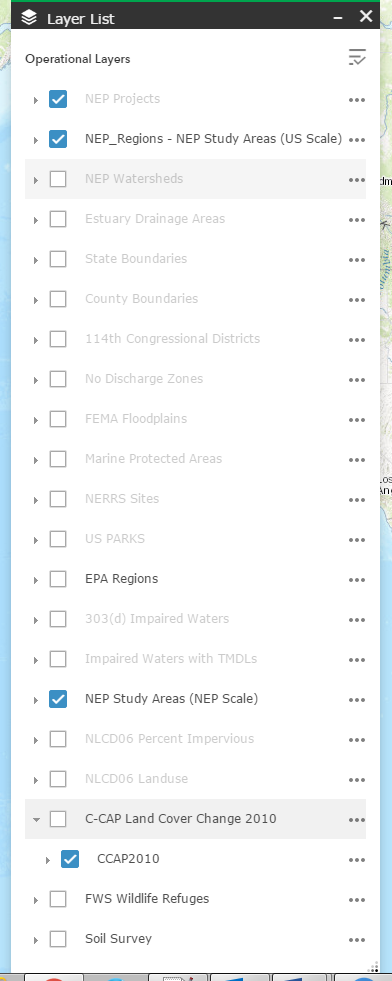
The Layer List Widget provides a list of layers in the map and allows you to interact with them in a variety of ways.
- Turn layers on and off by checking the box to the left of the layer name.
- Click the arrow to the left of the layer name to view the layer symbology or to view sub-layers, where applicable.
- Click the icon in the upper right of the widget to access the menu to turn all layers on or off, or expand or collapse all layers.
 View a larger version of this image.
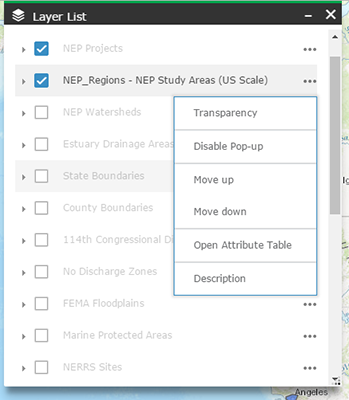
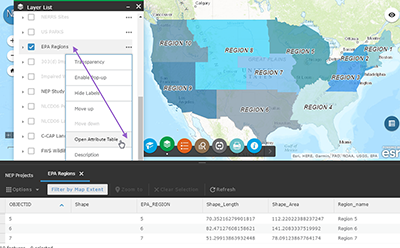
- Click the ellipsis to the right of a layer to access a menu of layer-specific functions.
 View a larger version of this image.
- Transparency: allows you to adjust the transparency of the layer from opaque (0%) to completely transparent (100%).
- Disable Pop-up: allows you to turn off pop-ups for the layer.
- Move up: allows you to place the layer higher in the Table of Contents so that it draws on top of other layers.
- Move down: allows you to place the layer lower in the Table of Contents so that it draws below other layers.
- Open Attribute Table: allows you to open the layer’s attribute table at the bottom of the screen.
- Description: opens the layer’s REST page where you can see basic metadata.
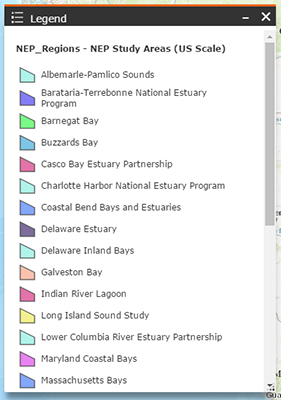
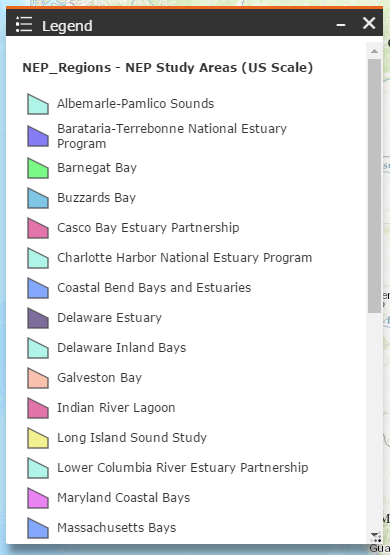
Legend Widget
The Legend Widget displays the visible layers in the map, along with their symbology. Note that the layers in NEPmap are drawn only at relevant scales, so it may be necessary to zoom in or out to make a layer appear in the legend.
 View a larger version of this image.
Query Widget
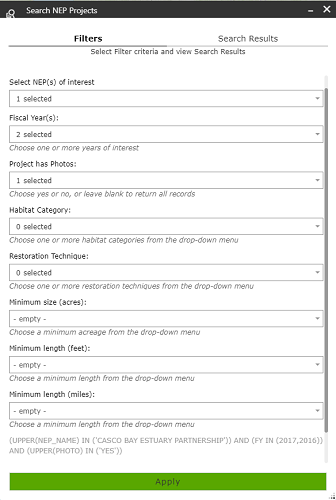
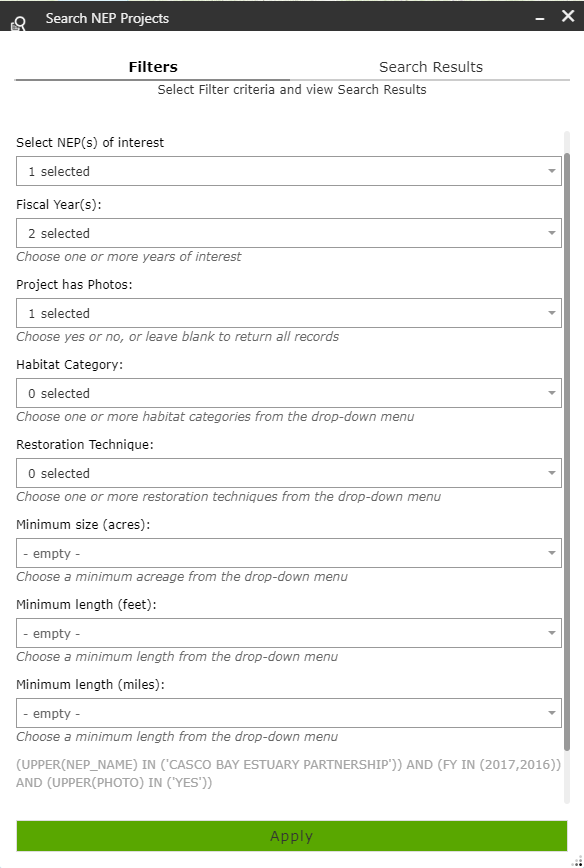
The Query (Search NEP Projects) Widget enables you to search for NEP projects based on user-specified input to a set of predefined criteria. The query widget creates a temporary layer of NEP projects that meet the criteria you define and adds it to the map.
Because the query widget generates a new layer, it is necessary to turn off the NEP Projects layer in the layer list widget in order to see only the queried projects. As an alternative to the query widget, you can create your own filter in the Attribute Table Widget to view only the desired projects directly in the NEP Projects layer. This is described in greater detail in the Filtering section of this user guide.
To run a query:
- Open the Query Widget

- Enter search criteria using the dropdown menus, ignoring any fields that are not of interest.
 View a larger version of this image.
- Scroll to the bottom of the query widget to view the SQL expression of your query and to choose a name for your output layer. When you are satisfied with the query, click Execute. Your new layer will be added to the map.
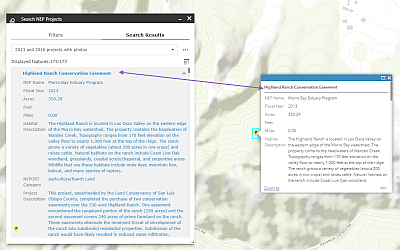
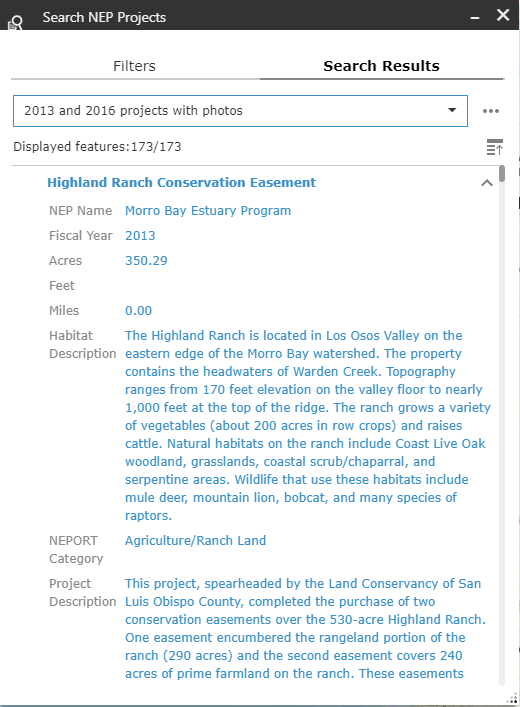
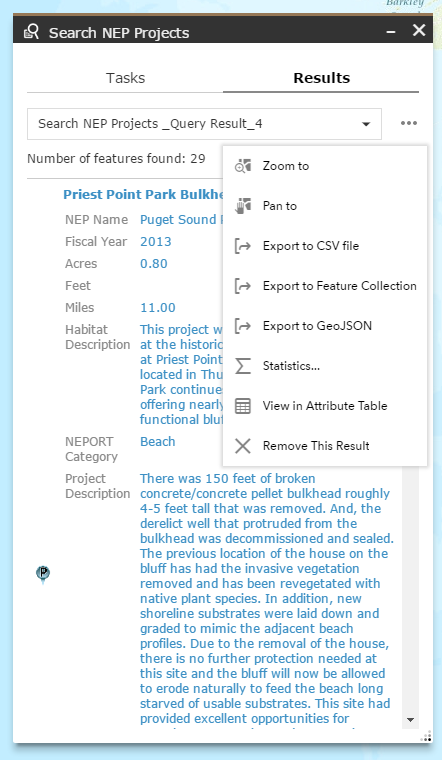
- The Search Results tab will show all projects that match your query criteria. You can view additional information about projects by clicking on the NEP name.
 View a larger version of this image
 - Alternatively, you can close the query widget to view the projects on the map. As a reminder, you will need to turn off the NEP Projects layer in the Layer List Widget to view only the results of the query layer.
 View a larger version of this image
 -
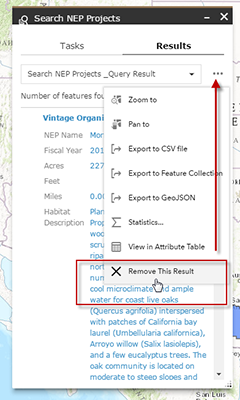
To remove the query, select the ellipsis in the results tab and select "Remove this Result". This will also remove the query layer from the Layer List.
 View a larger version of this image.
To expose additional functionality:
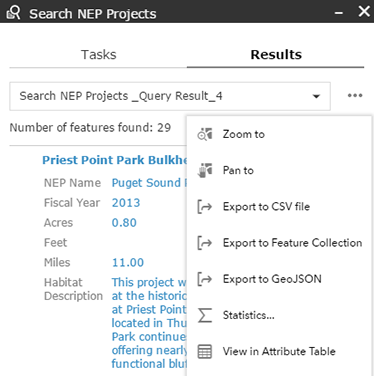
- Click the ellipsis in the Results tab to expose the following options:
- Zoom to – zooms the map to the selected record or records
- Pan to – pans the map to the selected record or records
- Flash – flashes (flickers) the selected record or records
- Export to CSV file – exports selected records to text file
- Export to Feature Collection – exports the selected records to a feature collection (a feature collection is a layer that can be added to a web map).
- Export to GeoJSON – exports the selected record or records to a GeoJSON file.
- Statistics – enables you to calculate summary statistics on numerical fields in the layer.
- View in Attribute Table – opens the selected record or records in the attribute table.
- Remove This Result – removes the record or records from the Results tab.
- Note that the Export and Statistics options will not be available if there is only one feature in the query result.
 View a larger version of this image.
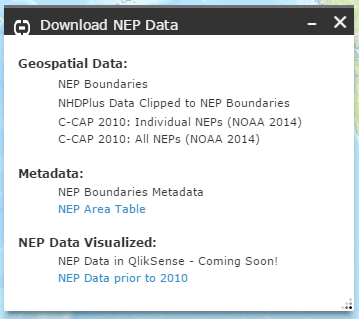
Download NEP Data
Click on the Download NEP Data Widget to access a list of downloadable files and ancillary data including:
- Geospatial data
- Metadata
- NEP Data Visualized
Print Widget
The Print Widget enables you to save the contents of your map to a file, which can then be printed.
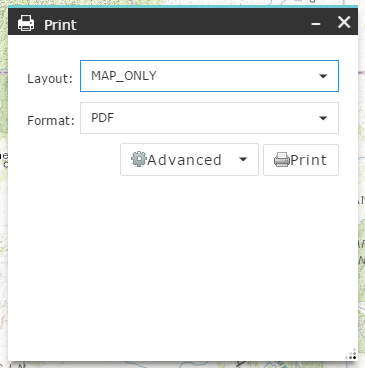
To print a map:
- Open the Print Widget
- Enter a map title
- Select a layout from the Layout: dropdown menu
- Select a file format from the Format: dropdown menu
- If desired, choose scale, extent and other properties by clicking the Advanced button
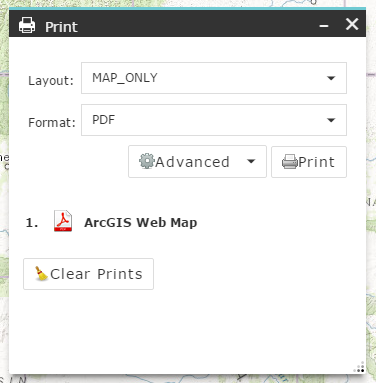
- Click Print.
- The widget will run and then produce a new file. Click on this file and choose to print or download.
Onscreen Widgets
Attribute Table Widget
The Attribute Table Widget allows you to view attributes such of the layers in the map. It can also be used to filter layers to display only features you want to see in the map. The attribute table widget is activated by clicking the icon at the lower right corner of the screen.
General Functionality
The attribute table will open across the bottom of the screen and can be resized vertically by grabbing the handle at the top of the widget.
 View a larger version of this image.
By default, only the table for NEP Projects is viewable, however, you can open the attribute tables for other layers by accessing them from the Layer List Widget or Popup, as mentioned above. You can switch between layer attribute tables by clicking the tabs along the top of the widget.
In the following example, the Layer List widget has been activated with EPA Regions selected. By accessing the options using the ellipses, the attribute table shows the attribute for EPA regions.
 View a larger version of this image.
Also by default, Filter by Map Extent is active. This function automatically filters the table to show records only in the viewable extent of the map. Because many layers in NEPmap only draw at specific scales, it is possible to have data appear in the table that do not appear on the map. If this is the case, you will need to zoom in or out to see the associated features.
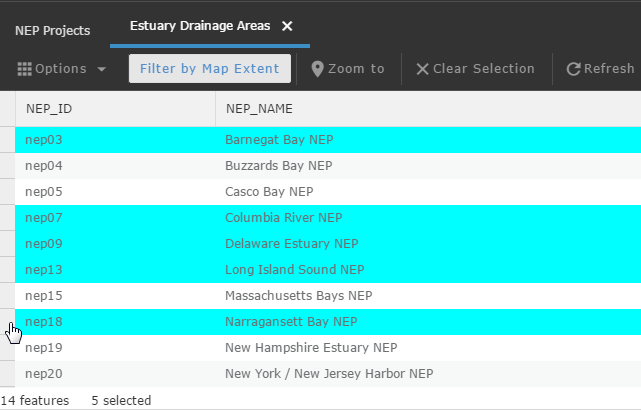
You can select records in the attribute table by clicking on the gray area to the left of each row of data. When selected, the row will be highlighted in blue. To select multiple rows by clicking multiple rows while holding the Shift or CTRL key. To clear a selection, click the Clear Selection button.
 View a larger version of this image.
With a selection made, you can click the Zoom to button to zoom in to selected items.
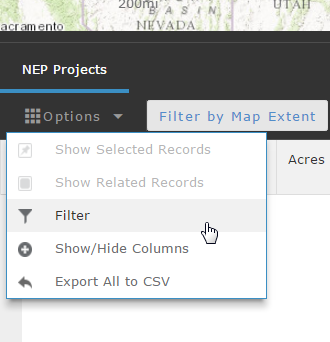
Options
The following additional functionality for the attribute table can be accessed through the Options menu.
- Show Selected Records toggles the table to show all records or only the selected ones.
- Filter allows you to subset the data by building an expression
- Show/Hide Columns allows you to turn available columns on/off
- Export Selected to CSV allows you to save your selection as a text file.
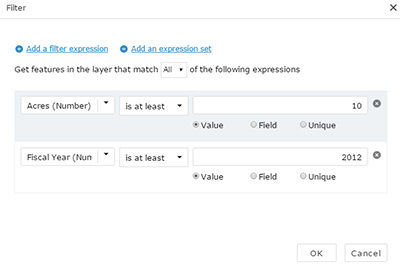
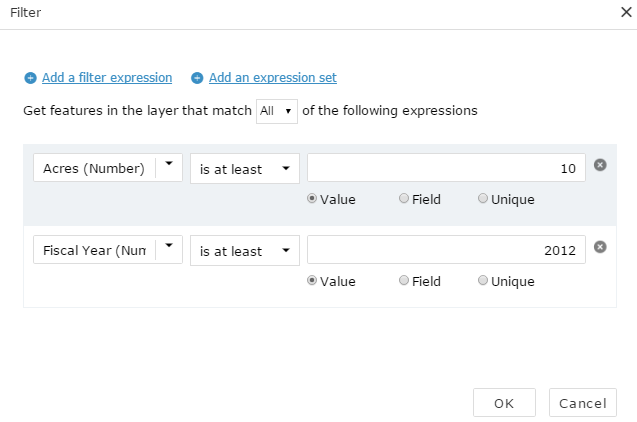
Filtering
The filter window allows you to build queries by stringing together filter expressions or expression sets. A filter expression includes a field name, and operator (ie. "is", "is not", "is less than", "is blank") and a value. An expression set is a group of expressions that is nested together. You can combine both expressions and expression sets into one filter.
To add an expression, click Add a filter expression in the Filter window. Build the expression by selecting the field and operator from their respective dropdown menus. Select the appropriate radio button for the value field and either enter a value, or choose the value from the list (if Field or Unique is selected, then values will appear in a dropdown list).
Add additional expressions or expression sets as needed, then hit OK.
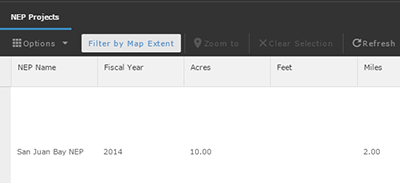
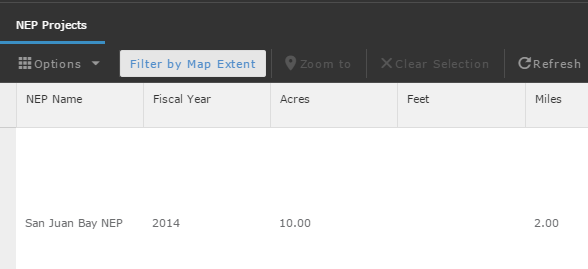
In the following example, the acre size is set to at least 10 miles, and the fiscal year is set to at least 2012. The a screen shot of the single result in the attribute table follows.
 View a larger version of this image.
Once a filter is activated, only those records will show up in the attribute table. To remove a filter, open the filter window and click the x to remove any expressions or expression sets, then click OK.
 View a larger version of this image.
Available Layers
- NEP Projects – NEP projects from 2010 to the most recently available year, symbolized by activity (Protection and Maintenance, Enhancement, Establishment or Restoration), with or without associated project photos.
- NEP Study Areas (US Scale) – NEP study area boundaries symbolized for easy viewing at a national scale.
- NEP Watersheds – HUC8 watersheds associated with NEP study areas.
- Estuary Drainage Areas – NOAA-developed layer representing drainage areas relevant to NEP study areas.
- State Boundaries – US state boundaries.
- County Boundaries – US county boundaries.
- 114th Congressional Districts – Boundaries of the 114th Congressional Districts.
- No Discharge Zones – A no discharge zone (NDZ) is an area in which both treated and untreated sewage discharges from vessels are prohibited.
- FEMA Floodplains – Any land area identified by FEMA as susceptible to being inundated by flood waters from any source.
- Marine Protected Areas – Boundaries and classification attributes for marine protected areas in the United States.
- NERRS Sites – National Estuarine Research Reserve System sites.
- US Parks – Parks and forests within the United States.
- EPA Regions – Boundaries of the 10 US-EPA regions.
- Impaired Waters – Impaired US waters within NEP study area boundaries for cycle years 2002-2012. This group layer includes sub-layers for impairment causes.
- Impaired Waters with TMDLs – Impaired US waters with established Total Maximum Daily Loads (TMDL) within NEP study area boundaries for cycle years 1998-2012. This group layer includes sub-layers for TMDLs.
- NEP Study Areas (NEP Scale) - NEP study area boundaries symbolized for viewing at a local scale.
- NLCD06 Percent Impervious – Percent impervious surface data from the 2011 version of the National Land Cover Dataset 2006, clipped to NEP study area boundaries.
- NLCD06 Landuse – Landuse/landcover data from the 2011 version of the National Land Cover Dataset 2006, clipped to NEP study area boundaries.
- C-CAP Land Cover Change 2010 – Land cover change data from NOAA’s Coastal Change Analysis Program, clipped to NEP study area boundaries.
- FWS Wildlife Refuges – Simplified boundaries of lands and waters administered by the US Fish and Wildlife Service.
- Soil Survey – Soil Survey Geographic (SSURGO) map unit polygons for the US.