Guide for Using STEPL Online Data Access System
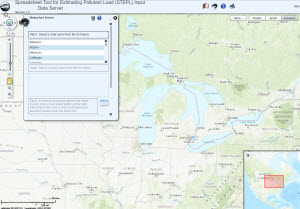
 The STEPL Input Data Server uses the ArcGIS Viewer for Flex 2.1. The ArcGIS Viewer for Flex is a ready-to-deploy, configurable client application that is built on the ArcGIS API for Flex. The Viewer application is designed to work with ArcGIS Server and ArcGIS Online Web services.
- Features
- Steps for Using the STEPL Online Data Access System
- Rules/Assumptions Made for STEPL On-line Data Access System
- Web Services Used in this Application
Questions or Comments?
Features
The web interface of this “Online Data Access System” has the following key features:
Top Panel
Search watershed boundary feature is selected by default.
![]() Add bookmark to the current extent of the map or zoom to the previously saved bookmark location.
Add bookmark to the current extent of the map or zoom to the previously saved bookmark location.
![]() Search watershed boundary and report STEPL model input data.
Search watershed boundary and report STEPL model input data.
![]() Identify feature on the map (select at least one from the list of background maps).
Identify feature on the map (select at least one from the list of background maps).
![]() Print the current view of the map.
Print the current view of the map.
Mid Panel
An extent of United States of America elevation map is shown by default.
Right Panel
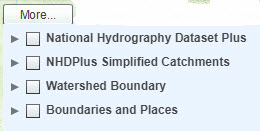
Select background map and additional GIS data layers as an optional feature.
![]() Switch background map to view street, aerial, or elevation map.
Switch background map to view street, aerial, or elevation map.
 Select check box to view additional background map layers.
Left Panel
 Zoom to full extent of the map (to see the entire map). Pan the map (right, left, up, and down).
![]() Zoom to previous or next extent of the map.
Zoom to previous or next extent of the map.
 Zoom in or out sliding bar.
![]() Pan the map (move the map in the view).
Pan the map (move the map in the view).
 Zoom in to, and out from, a location on the map (by rectangle).
Bottom Panel
![]() Overview map window.
Overview map window.
![]() View map scale, and the location (latitude and longitude) of the cursor on the map.
View map scale, and the location (latitude and longitude) of the cursor on the map.
Steps for Using the STEPL Online Data Access System
- On the watershed search window, select a State name from the state list. The map will zoom to the State you have selected.
- Select a County name from the County list. The map will zoom to the County you have selected.
- Click the run report button
 to obtain a report in a new window which provides data for the entire county, or go to Step 4.
 - Select one or moresubwatershed(s) names from the HUC12 subwatershed list. The map will zoom to thesubwaterhsed(s) you have selected.
- Click the run report button
 to obtain a report in a new window. The report will provide the following tables for the HUC12 subwatershed(s) you have selected:
- Information for selected HUC12 subwatersheds(based on USDA-NRCS, USGS, and USEPA)
- Landuse area (in acres) for selected HUC12 subwatershed(s) (based on NLCD and USDA Cropland Data Layer (CDL), 2011)
- Agricultural animals distribution for selected HUC12 subwatershed(s) (based on USDA Census of Agriculture, 2012)
- Septic system data for selected HUC12 subwatershed(s) (based on septic system surveys by the National Small Flows Clearinghouse Exitin 1992 and 1998)
-
Hydrological soil group for selected HUC12 subwatershed(s) (based on the STATSGO database)
Landuse areas in the Landuse Area table include feedlots. Feedlot areas are estimated based on the following minimum space requirement by farm animals:
The table format is consistent with the required table format in the STEPL model.- Beef cow: 25 ft2
- Dairy cow: 40 ft2
- Swine: 15 ft2
- Chicken: 1 ft2
- Horse: 45 ft2
- Sheep: 8 ft2
- Turkey: 6 ft2
- Duck: 3 ft2
- Export the results from the report tables to an Excel spreadsheet for use in STEPL model to estimating the pollutant loads.
Rules/Assumptions Made for STEPL Online Data Access System
- The user can select only one State and one County name from each list.
- The user can select one or more HUC12 subwatershed(s) boundary names from the list.
- The results are generated at HUC12 level.
- The landuse data source is NLCD and USDA Cropland Data Layer (CDL), 2011.
- The agricultural animal data source is at the County level and is summarized at the HUC12 level based on the pastureland area weighted ratio.
- The septic system data source is at the County level and is summarized at the HUC12 level based on the low-density residential area weighted ratio.
- The Hydrologic Soil Group (HSG) is summarized at the HUC12 subwatershed.
