Documented Hypoxia and Associated Risk Factors in Estuaries, Coastal Waters, and the Great Lakes Ecosystems
About this indicator
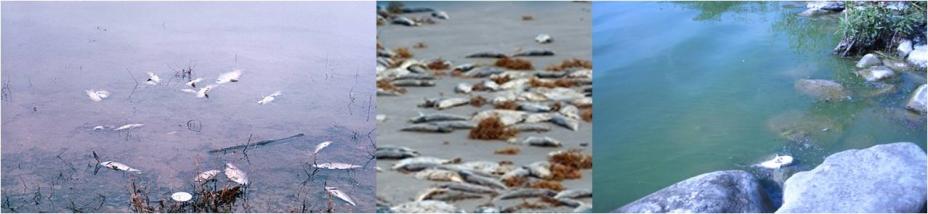
Hypoxia exists when water has dissolved oxygen concentrations too low to support fish and other important animal species. Hypoxia is strongly linked to eutrophication in aquatic systems as the decomposition of large amounts of organic matter (i.e., from algal blooms) leads to oxygen depletion. This indicator presents the number of coastal and Great Lakes ecosystems per state with ‘documented’ or ‘concern for’ hypoxia as detailed in the 2010 Scientific Assessment of Hypoxia in U.S. Coastal Waters report, as well as the total number of systems evaluated in each state. Ecosystems with ‘documented’ hypoxia experience low dissolved oxygen concentrations leading to hypoxia (i.e., dissolved oxygen concentrations < 2 mg/L) and show evidence that the hypoxia was caused, at least in part, by anthropogenic activity, mostly related to eutrophication. Systems with ‘concern for’ hypoxia demonstrate risks for and/or signs of eutrophication, including elevated nutrient and chlorophyll a concentrations or harmful algal blooms. These ecosystems are considered at risk of becoming hypoxic.
Number of state estuarine, coastal, and Great Lakes ecosystems with documented hypoxia or concern for hypoxia (i.e., presence of elevated nutrient concentrations, chlorophyll a levels, or harmful algal blooms). Also shown is the total number of ecosystems evaluated in each state.
| State | # of hypoxic ecosystems | Total # of ecosystems reviewed |
|---|---|---|
| Alabama | 10 | 10 |
| Alaska | 1 | 1 |
| California | 19 | 28 |
| Connecticut | 8 | 12 |
| Delaware | 9 | 10 |
| Florida | 108 | 132 |
| Georgia | 17 | 24 |
| Hawaii | 1 | 1 |
| Illinois | No data | No data |
| Indiana | No data | No data |
| Louisiana | 21 | 32 |
| Maine | 4 | 24 |
| Maryland | 30 | 59 |
| Massachusetts | 11 | 17 |
| Michigan | 0 | 3 |
| Minnesota | No data | No data |
| Mississippi | 13 | 17 |
| New Hampshire | 1 | 3 |
| New Jersey | 11 | 15 |
| New York | 27 | 29 |
| North Carolina | 26 | 36 |
| Ohio | 2 | 3 |
| Oregon | 5 | 15 |
| Pennsylvania | No data | No data |
| Rhode Island | 6 | 6 |
| South Carolina | 26 | 37 |
| Texas | 39 | 53 |
| Virginia | 13 | 46 |
| Washington | 25 | 35 |
| Wisconsin | No data | No data |
Note - Data are based on an extensive review of literature and national assessments which evaluated 647 U.S. coastal, estuarine, and Great Lakes ecosystems, and are current through December 2008. The total number of ecosystems in each state and nationwide is not determined, therefore these numbers may not fully represent the extent of hypoxia in each state.
Source: Scientific Assessment of Hypoxia in U.S. Coastal Waters report (Interagency Working Group 2010)
Download the Hypoxia data table (excel)(2 pp, 13 K)
Source of data
1. Committee on Environment and Natural Resources. 2010. Scientific Assessment of Hypoxia in U.S. Coastal Waters. Interagency Working Group on Harmful Algal Blooms, Hypoxia, and Human Health of the Joint Subcommittee on Ocean Science and Technology. Washington, DC.
Data source information
Data are from the 2010 Scientific Assessment of Hypoxia in U.S. Coastal Waters report developed by the Interagency Working Group on Harmful Algal Blooms, Hypoxia, and Human Health, which was chartered through the Joint Subcommittee on Ocean Science and Technology of the National Science and Technology Council and the Interagency Committee on Ocean Science and Resource Management Integration. In developing this report, the Working Group conducted an extensive review of literature and national assessments, obtaining hypoxia and risk information from 647 U.S. coastal and Great Lakes systems. Data are current through December 2008.
What to consider when using these data
Thirty states (not including territories) have coastal and Great Lakes segments, however no data were available for Illinois, Indiana, Minnesota, Pennsylvania, or Wisconsin. Because the universe of waterbody ecosystems (i.e., total number of U.S. coastal and Great Lakes ecosystems) is not provided in the Working Group’s report, it is unknown to what extent these data may understate the levels of hypoxia and associated risk factors in U.S. coastal and Great Lakes systems.
References and links to other data sources
1. Diaz, R. J., R. Rosenberg. 2008. Spreading dead zones and consequences for marine ecosystems. Science. Vol. 321, pp. 926-929.
2. Bricker, S., B. Longstaff, W. Dennison, A. Jones, K. Boicourt, C. Wicks, and J. Woerner. 2007. Effects of Nutrient Enrichment in the Nation's Estuaries: A Decade of Change. NOAA Coastal Ocean Program Decision Analysis Series No. 26. National Centers for Coastal Ocean Science, Silver Spring, MD.
3. U.S. Geological Survey. EarthWord: Hypoxia, for a definition. Refer to the following site for more information on the USGS efforts in the Gulf of Mexico Hypoxic Zone.
4. National Oceanic and Atmospheric Administration. National Coastal Data Development Center: Gulf of Mexico and NOAA Hypoxia Information.