East Liverpool, Ohio and Glasgow Borough, Pennsylvania– Air Monitoring Data
- Settlement
- Introduction and Summary
- Fenceline Data
- March 2019 Additional Air Emissions controls Installed
- November 2017 Monthly Manganese Concentration Exceedance
- NEIC report
- Soil Sampling
- Potential health effects of manganese
- About the monitoring
- Understanding the data
- About the data
- Air monitoring results charts and graphs
- Soil sampling locations
- February 27, 2018 version of webpage
Settlement
The U.S. Environmental Protection Agency and the U.S. Department of Justice have finalized a consent decree with S.H. Bell Company requiring the company to monitor and take measures to reduce manganese emissions from its 92-acre plant that spans the Pennsylvania-Ohio border in Ohioville, Pa. and East Liverpool, Ohio.
This federal action builds upon actions previously taken by the Ohio Environmental Protection Agency and the Pennsylvania Department of Environmental Protection.
- Consent Decree
- Press Release: EPA Settlement with S.H. Bell Requires Manganese Emission Safeguards in Ohioville, Pa. and East Liverpool, Ohio - March 7, 2018
- Press Release: Settlement with S.H. Bell Requires Manganese Emission Safeguards at Plant in Ohioville, Pa. and East Liverpool, Ohio - Jan. 18, 2017
Introduction and Summary
Since 1999, U.S. Environmental Protection Agency, Ohio EPA and the federal Agency for Toxic Substances and Disease Registry (ATSDR) have monitored and analyzed the airborne levels of metals, including manganese (Mn) in East Liverpool, Ohio, at three monitoring stations. EPA has established this website as a means of providing the community with recent monitoring results and information concerning the airborne manganese levels.
Manganese is a naturally occurring element found in many soils, rocks and foods. While the element is an essential nutrient for living organisms, including humans, it is also necessary for the production of steel and is commonly found in industrial settings. Manganese can become toxic in humans at elevated exposure levels, leading to neurological and neuropsychological damage.
Data from 2006-2013 showed a downward trend of manganese concentrations recorded at the air monitors in East Liverpool. From 2014 - 2015 monitoring results showed an increase in manganese levels. This increase raised concerns at EPA, Ohio EPA, the Pennsylvania Department of Environmental Protection (PADEP) and ATSDR. The PADEP conducted additional air monitoring in Glasgow Borough, Pennsylvania from Oct. 26, 2014, to July 5, 2015. EPA officials also requested assistance from ATSDR to evaluate the potential health implications of the increased airborne manganese levels. ATSDR Letter Health Consultation (PDF) (13 pp, 1.4 MB, About PDF) (2016)
EPA is working with Ohio EPA and PADEP to reduce ambient manganese concentrations.
- Pennsylvania Health Department Letter Consultation for Glagow (PDF) (10 pp, 144 K, About PDF) Exit
- Fact Sheet: Health Study of Airborne Manganese Exposure in East Liverpool, Marietta and Mt. Vernon, Ohio (2013)
- Assessing Outdoor Air Near Schools: East Elementary School, East Liverpool, Ohio
- ATSDR Health Consultation for East Liverpool, Ohio Air Quality (PDF) (39 pp, 1.8 MB, About PDF) (2010)
Some of these reports were made publicly available shortly after their publication.
S.H. Bell’s Fenceline Manganese Concentration Measurements under the Consent Decree
The consent decree required S.H. Bell to set up a fenceline air monitoring system to measure the respirable manganese concentrations. The system went online on August 20, 2017 consisting of three air monitors (East, South, and West) shown in Figure below. 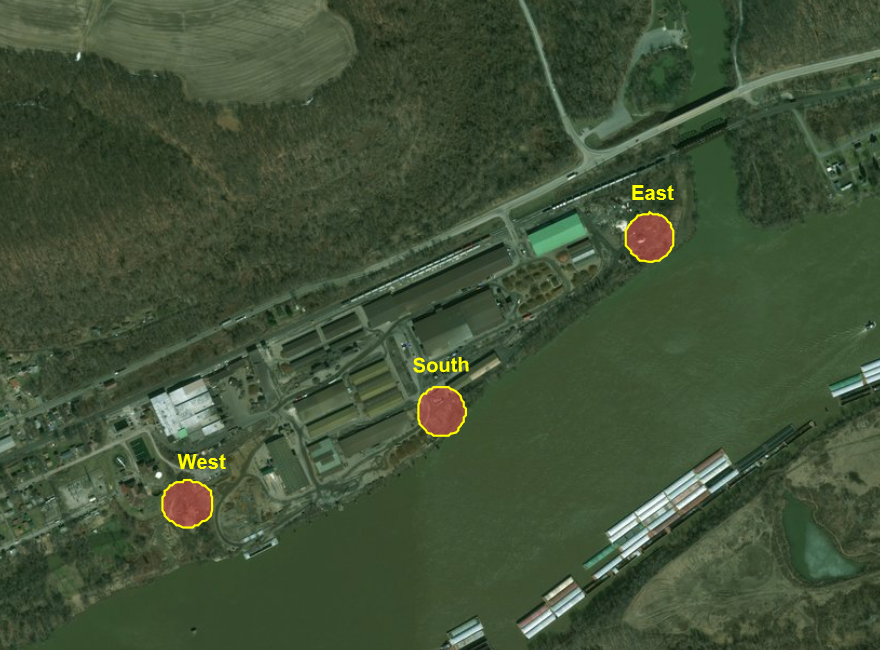 Figure: S.H. Bell Fenceline Monitor Locations (click to enlarge)
S.H. Bell has been submitting to U.S. EPA the manganese concentration data as recorded by the East, South, and West monitors. The manganese concentrations data is available here SH Bell Fence-line Manganese Concentration Measurements through June 25, 2020(386 K) .
March 2019 Additional Air Emissions Controls Installed to Address Monthly Manganese Concentration Exceedance
In November 2017, ambient air monitors installed around the S.H. Bell facility measured manganese at concentrations that triggered a requirement in the federal consent decree for S.H. Bell to take action to reduce emissions. The consent decree requires S.H. Bell to take specific actions that are approved by U.S. EPA. On July 20, 2018, U.S. EPA issued a letter to S.H. Bell outlining its review and approval of additional measures to reduce manganese emissions from S.H. Bell’s operations. U.S. EPA determined that the unloading of manganese materials at S.H. Bell’s loading dock was the most significant contributor of the November 2017 increased manganese concentrations, and required that S.H. Bell submit a plan to U.S. EPA within 30 days to purchase, install and operate two additional misters at its loading dock. Misters are equipment that spray a fog, or mist of water around the manganese handling equipment to suppress and capture manganese dust so it does not travel offsite. In S.H. Bell's response, the company committed to the purchase of two additional misters. Installation of the misters began on January 18, 2019, and since March 4, 2019, the two misters have operated when S.H. Bell unloads manganese materials at its loading dock.
November 2017 Monthly Manganese Concentration Exceedance at the West Monitor
The consent decree requires S.H. Bell to take specific actions if the monthly and/or annual ambient manganese averages exceed certain action levels. These actions include submitting a root cause analysis plan to U.S. EPA identifying the cause of the increased manganese concentration(s) and describing additional efforts to reduce the increased manganese emissions. S.H. Bell’s west monitor exceeded the monthly action level established by the Consent Decree in November 2017. On January 17, 2018, S.H. Bell submitted a proposed root cause analysis plan for U.S. EPA approval which determined that manganese processing on November 27, 2017 was the cause of the exceedance. U.S. EPA is currently reviewing the plan. Specific information can be found about the fenceline monitoring system and the manganese thresholds that require actions at paragraphs 8, 18-22 in the consent decree.
NEIC report reinforces previous analysis showing S.H. Bell as major contributor of airborne manganese
In July 2016, EPA requested its National Enforcement Investigations Center (NEIC) to determine the major contributor of airborne manganese to the East Liverpool airspace by examining manganese-bearing particulate material collected from air filters in 2014-2015 from East Liverpool, Ohio; Glasgow, Pennsylvania; and Chester and Lawrenceville Park, West Virginia and particulate process materials from S.H. Bell and surrounding commercial facilities.
NEIC analyzed the air filters and particulate process samples to characterize the morphology, size and composition of the samples to “provide a signature” by determining the relative magnitudes of the elemental compounds.
The results of the analyses from air filters and process materials further supported earlier monitoring analysis conducted in 2016 that indicated that S.H. Bell was the major contributor of airborne manganese-bearing particulate matter in the East Liverpool, Ohio and Glasgow, Pennsylvania communities.
Soil Sampling
EPA conducted soil sampling in publicly owned areas of the East Liverpool and Glasgow communities the week of Oct. 17, 2016 due to concerns about elevated airborne manganese levels detected by air monitors in the area. These soil samples were analyzed for manganese and other metals. EPA reviewed the findings, compared the manganese levels to EPA’s Removal Management Level (RML) and ATSDR’s Comparison Value (CV) for manganese, and found that the reported manganese levels in the soil do not pose a health concern to the residents in the communities. This is also the case for iron and chromium levels. The evaluation considered several factors, including, but not limited to, the accessibility of the location, the frequency and duration of exposure, soil vegetative cover, and the population potentially exposed.
RMLs help identify areas, contaminants, and conditions where a removal action (for contamination posing an immediate threat to human health and the environment) may be appropriate. Sites where contaminant concentrations fall below RMLs, are not necessarily “clean,” and further action or study may be warranted under the Federal Superfund program. In addition, sites with contaminant concentrations above the RMLs may not necessarily warrant a removal action depending upon such factors as background concentrations, the use of site-specific exposure scenarios or other program considerations.
Information on RMLs and Removal Actions
Similarly, a CV is a dose or a calculated concentration of a substance in air, water, food, or soil that is unlikely to cause harmful (adverse) health effects in exposed people. ATSDR derives CVs from scientific studies which it modifies by safety factors to be more protective of human health, thus establishing the CV for a contaminant well below levels that are known or anticipated to result in adverse health effects.
ATSDR's Public Health Assessment Guidance Manual
The risk-based values derived by EPA and ATSDR for concentrations of manganese in residential soil are more protective of human health, and assume more frequent exposure to the contaminant than expected to occur at the sampled locations. Thus, an exceedance of these values at one or more locations does not necessarily indicate that EPA action is necessary to reduce exposure.
EPA’s RML for a residential exposure scenario:
- RML = 5,400 mg/kg of manganese
ATSDR CV for long-term (chronic) manganese exposure:
- Residential child exposure scenario = 2,900 mg/kg
- Residential adult exposure scenario = 40,000 mg/kg
Potential health effects of manganese
Humans require the mineral manganese in very small amounts to function normally. Most of our intake of manganese is from what we eat and drink. However, exposure to excess manganese can occur through inhalation of particulate matter containing manganese. Most of what we know about manganese as a neurotoxin, a substance that can damage the nervous system, comes from high levels of inhalation exposure in occupational and animal studies. Prolonged inhalation of airborne manganese can provoke a variety of serious toxic responses in humans, including impaired movement and effects on memory, judgment and reasoning. EPA conducted a recent study of the health impacts of manganese exposure in the East Liverpool community.
For more information about manganese exposure see ATSDR's Manganese Tox Profile (PDF)(555 pp, 10 MB, About PDF)
About the monitoring
 Ambient air monitoring locations in the vicinity of East Liverpool, Ohio.
Beginning in 1999, ambient air monitors have measured manganese levels in East Liverpool by collecting 24-hour samples every sixth day at two monitoring stations on Maryland Ave. and at George St., and every third day at the monitoring station located at the Water Treatment Plant (WTP). The ambient air monitor in Glasgow, Penn. collected 24 hour samples every 6th day from Oct. 26, 2014 - July 25, 2015. Ambient air monitors in Chester and Lawrenceville, W. Va. collected 24 hour samples at least once a month. Ohio EPA, PADEP and West Virginia Department of Environmental Protection maintain their monitors, collect the samples, arrange for analysis and compile the results, which are then shared with U.S. EPA.
Understanding the data
ATSDR
In 2012, ATSDR evaluated available human and animal toxicity studies on manganese and derived a minimal risk level (MRL) for chronic manganese inhalation exposure of 0.3 µg/m3 (micrograms manganese per cubic meter).
EPA
In 1993, EPA’s Integrated Risk Information System (IRIS) evaluated available human and animal toxicity studies on manganese and derived a reference concentration (RfC) for chronic manganese inhalation exposure of 0.05 µg/m3. The 2015 IRIS Program Multi-Year Agenda listed manganese as having the highest priority for reassessment. This reassessment will determine if there is new information that could lead to a revised RfC.
- EPA Inhalation Reference Concentration for Manganese (PDF) (46 pp, 258 K, About PDF) (1993)
Significance of a Minimal Risk Level or Inhalation Reference Concentration
- Airborne concentrations of a pollutant that are below the MRL or RfC for a pollutant are unlikely to cause harmful health effects in humans.
-
Airborne concentrations that are greater than a MRL or RfC do not automatically mean there is a public health hazard caused by these emissions, but that further evaluation is needed.
About the data
The tables and figures below contain a summary of the manganese data collected at the air monitors in the vicinity of East Liverpool, Ohio. It is important to understand the difference between manganese levels measured as total suspended particulate (TSP) and manganese levels measured as respirable particulate. TSP is made up of respirable particles (small particles that can pass deep into the lung) and non-respirable particles (larger particles intercepted in upper airways before passing deep into the lung). MRL and RfC values are based on the respirable fraction of manganese-containing particulates (less than 10 microns in aerodynamic diameter i.e. PM10.)
Air monitoring results charts and graphs
| Monitoring Year | Annual Average TSP Mn Concentration (µg/m3) | TSP Mn Concentration Range (µg/m3)* |
|---|---|---|
| 2013 | 1.10 | 0.04 - 13.00 |
| 2014 | 1.48 | 0.03 - 32.00 |
| 2015 | 2.18 | 0.07 - 18.00 |
| 2016 | 0.91 | 0.03 - 11.00 |
| 2017 | 0.72 | 0.03 - 16.80 |
| 2018 | 0.51 | 0.01 - 4.01 |
| 2019 | 0.58 | 0.02 - 2.46 |
| 2020 | TBD | TBD |
*The range represents individual readings taken every 3 days over the specified time period.
Water Treatment Plant, East Liverpool, Ohio, Monthly Average Manganese TSP Concentrations Jan. 2020
Water Treatment Plant, East Liverpool, Ohio Daily Manganese TSP Concentrations 2013-2020
Glasgow, Penn. TSP and Respirable Data from Oct. 26, 2014 - July 5, 2015
Table 2: Water Treatment Plant Monthly PM10 Averages
| 2015 | 2016 | 2017 |
2018 | 2019 | 2020 | |
|---|---|---|---|---|---|---|
| January | 0.08 | 0.36 | 0.07 | 0.07 |
0.08 |
0.62 |
| February | 0.08 | 0.09 | 0.13 | 0.12 |
0.40 |
|
| March | 0.41 | 0.09 | 0.06 | 0.06 | 0.04 | |
| April | 0.32 | 0.19 | 0.33 | 0.07 | 0.12 | |
| May | 0.18 | 0.21 | 0.12 | 0.09 | 0.10 | |
| June | 0.42 | 0.05 | 0.02 | 0.14 | 0.05 | |
| July | 0.38 | 0.04 | 0.04 | 0.16 | 0.06 | |
| August | 0.62 | 0.11 | 0.12 | 0.07 | 0.07 | |
| September | 0.34 | 0.09 | 0.07 | 0.18 | 0.15 | |
| October | 1.38 | 0.04 | 0.06 | 0.22 | 0.07 | |
| November | 0.25 | 0.19 | 0.66 | 0.13 | 0.06 | |
| December | 0.15 | 0.05 | 0.17 | 0.13 | 0.11 |
Water Treatment Plant, East Liverpool, Ohio, Monthly PM10 Manganese Concentrations
Table 3: Water Treatment Plant Annual PM10 Averages and Range
| Monitoring Year | Annual Average PM10 Manganese Concentration (µg/m3) | PM10 Manganese Concentration Range (µg/m3)* |
|---|---|---|
| 2009 | 0.16 | 0.01 - 1.10 |
| 2011 | 0.22 | 0.00 - 2.45 |
| 2012 | 0.11 | 0.01 - 1.40 |
| 2013 | 0.12 | 0.01 - 1.00 |
| 2014 | 0.21 | 0.01 - 3.60 |
| 2015 | 0.39 | 0.02 - 3.40 |
| 2016 | 0.14 | 0.02 - 1.10 |
| 2017 | 0.20 | 0.01 - 3.00 |
| 2018 | 0.12 | 0.01 - 0.28 |
| 2019 | 0.11 | 0.02 - 0.80 |
| 2020 | TBD | TBD |
*The range represents individual readings taken every 6 days over the specified time period.
Water Treatment Plant, East Liverpool, Ohio, Manganese PM10 Concentrations Data (2009, 2011-2020)
 East Liverpool, Ohio Soil Sampling Locations
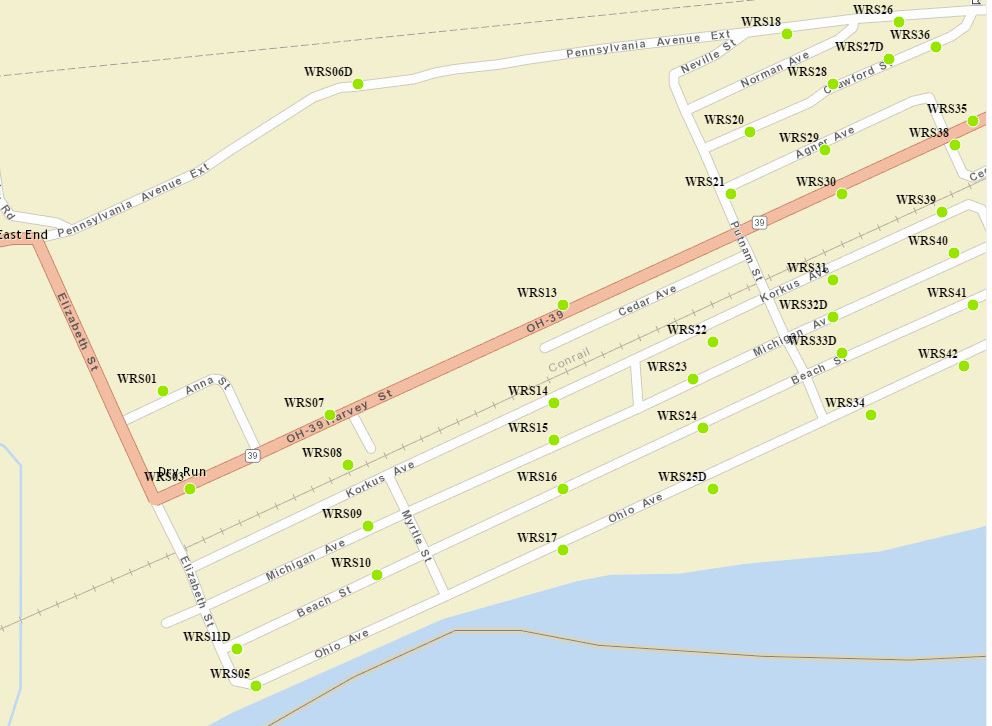 East Liverpool, Ohio Soil Sampling Locations
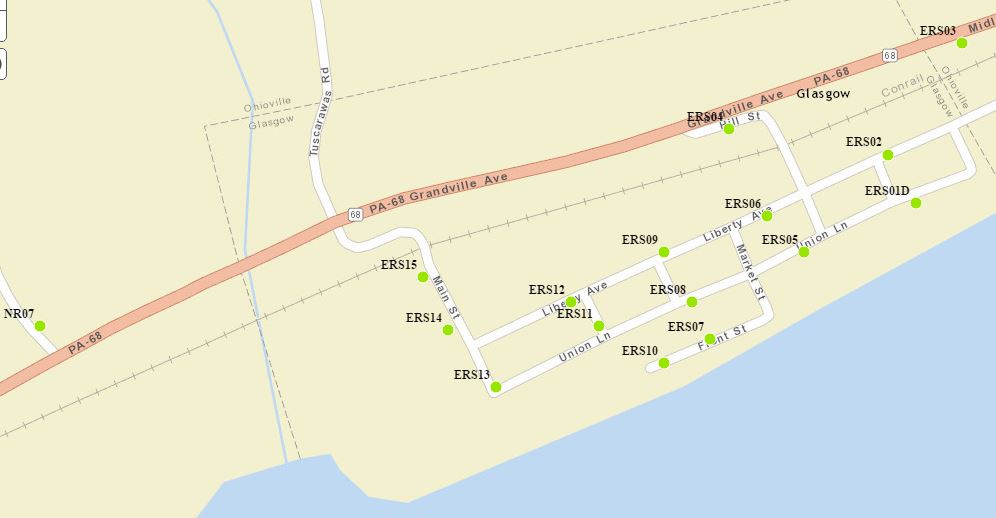 Glascow Borough, Pennsylvania Soil Sampling Locations