Finalization of Guidance on Incorporation of Water Treatment Effects on Pesticide Removal and Transformations in Drinking Water Exposure Assessments
-
Attachment 1 Revisions Made to Guidance Document Entitled "The Incorporation of Water Treatment Effects on Pesticide Removal and Transformations in Food Quality Protection Act (FQPA) Drinking Water Assessments"
-
-
1.2 Background
-
-
-
-
2.3(a) Conventional Treatment
-
2.3(a)1 Coagulation/Flocculation
-
2.3(a)2 Softening
-
2.3(a)3 Sedimentation
-
2.3(a)4 Filtration
-
-
2.3(c) Carbon Adsorption
-
2.3(c)1 Powdered Activated Carbon (PAC)
-
2.3(c)2 Granular Activated Carbon (GAC)
-
-
2.3(d) Membrane Treatment
-
2.3(d)1 Reverse Osmosis (RO)
-
2.3(d)2 Nanofiltration (NF)
-
-
2.3(e) Corrosion Control Treatments
-
2.3(f) Aeration/Air Stripping
-
-
-
-
2.4(b)1 Chlorination By-products
-
2.4(b)2 Ozonation By-products
-
-
-
-
Appendix A Removal of Pesticides Using Different Reverse Osmosis Membranes
MEMORANDUM
December 5, 2011
SUBJECT: Finalization of Guidance on Incorporation of Water Treatment Effects on Pesticide Removal and Transformations in Drinking Water Exposure Assessments
FROM: /s/ Donald Brady, Director, Environmental Fate and Effects Division (7507P), Office of Pesticide Programs
TO: Environmental Fate and Effects Division (7507P), Office of Pesticide Programs
Through this memorandum I am announcing a limited update and revision of the existing guidance entitled "The Incorporation of Water Treatment Effects on Pesticide Removal and Transformations in Food Quality Protection Act (FQPA) Drinking Water Exposure Assessments". The revised document is dated August 18,2011 and will be made available [on the Models for Pesticide Risk Assessment] webpage. Revisions reflect an error-only review of the original document and a limited update in the literature review section on treatment processes removing pesticides (Section 24(b) 1). A partial listing of the revisions is provided in Attachment 1. Updated content is limited and only includes additional information on oxon formation during disinfection of waters containing organophosphate pesticides. The guidance discusses how EFED considers and uses data on pesticide removal resulting from drinking water treatment processes. It does not discuss study protocols designed to capture such information, nor does it discuss how EFED will evaluate pesticide chemical structure information to predict potential formation of transformation products of concern during the treatment process. Guidance on these topics is under development.
In general, any drinking water modeling that begins on or after the week of August 29,2011 and addresses removal of pesticides resulting from drinking water treatment should be conducted after review and consistent with "The Incorporation of Water Treatment Effects on Pesticide Removal and Transformations in Food Quality Protection Act (FQPA) Drinking Water Exposure Assessments" document dated August 18, 2011.
Attachment 1
Revisions Made to Guidance Document Entitled "The Incorporation of Water Treatment Effects on Pesticide Removal and Transformations in Food Quality Protection Act (FQPA) Drinking Water Assessments"
The following updated information was added to the aforementioned document, originally dated October 25,2011.
-
Added 2009 OP data to Section 2.4(b) 1 (formerly Section 3.8(b)1), Chlorination By-Products, including Tables 14 and 15.
-
Updated information on Maximum Contaminant Levels (MCLs) in Section 1.3.
-
Updated Section 4.0 to ensure all references cited in text were included, as well as removing references that were not cited.
In addition to the limited updates to the content of the document, the following is a partial list of the editorial changes that were made. Additional editorial revisions (e.g., rewording, sentence reformatting, etc.) were too numerous to itemize. These edits were mostly grammatical in nature; the technical material provided in the document was not changed.
-
4. Added list of authors to cover page.
-
5. Added Signature page and Summary of Revisions page. Updated Acknowledgements page and moved to front of document.
-
6. Restructured Executive Summary.
-
7. Section 2.1 - moved to Section 1.1 and rewritten. Moved specific comments provided by SAP to Section 2.6.
-
8. Moved Section 2.2 to Section 3.0 and Section 3.1.
-
9. Moved Section 2.3 to Section 3.2.
-
10. Moved Section 3.1 to Section 2.5. Last paragraph of Section 3.1 moved to 2nd paragraph in Section 2.7.
-
11. Moved Section 3.2 to Section 1.2.
-
12. Moved section 3.3 to section 2.0.
-
13. Moved Section 3.4 to section 1.3.
-
14. Moved Section 3.5 to Section 2.1.
-
15. Moved Section 3.6 to Section 2.2.
-
16. Moved Section 3.7 to Section 2.3.
-
17. Moved Section 3.8 to Section 2.4.
-
18. Moved Section 3.9 to Section 2.7.
The Incorporation of Water Treatment Effects on Pesticide Removal and Transformations in Food Quality Protection Act (FQPA) Drinking Water Assessments
Authors: James Hetrick, Ph.D.; Rudolfo Pisigan, Jr., Ph.D.; Elizabeth Behl, Chuck Peck
Office of Pesticide Programs, Environmental Protection Agency
August 18,2011
Final Signatures
This version of the drinking water treatment manual has been reviewed by the following individuals.
/s/ James Hetrick, Senior Science Advisor, ERB 3/EFED; Date: 12/5/11
/s/ Nelson Thurman, Senior Science Advisor, ERB2/EFED; Date: 12/5/11
/s/ Charles Peck, Environmental Engineer, ERB4/EFED; Date: 12/5/11
/s/ Marietta Echeverria, Branch Chief, ERB4/EFED; Date: 12/5/11
Acknowledgements
The Office of Pesticide Programs, Environmental Fate and Effects Division would like to recognize and thank the following sources for contributing to this report:
-
Technical quality assurance of the water treatment section was evaluated using internal peer reviewers from the EPA/Office of Pesticide Programs Water Quality and Aquatic Exposure Technical Team (Dr. Jim Cowles, Dr. R. David Jones, Dr. Lawrence Libelo, Mr. Nelson Thurman, Mr. Sid Abel, Ms. Stephanie Syslo, Mr. James Breithaupt, and Dr. Cheryl Sutton), EPA/Office of Ground Water and Drinking Water (Mr. Jeff Kempic) and EPA/Office of Research and Development (Dr. Thomas Speth).
-
External technical reviewers include American Water Works Association (AWWA) and CropLife America (formerly American Crop Protection Association).
Summary of Revisions
This document updates and supersedes The Incorporation of Water Treatment Effects on Pesticide Removal and Transformations in food Quality Protection Act (FQPA) drinking Water Assessments, dated October 25, 2001. It reflects an error-only review of the draft document and a limited update in the literature review section on treatment processes removing pesticides. The update is limited to the inclusion of additional data on oxon formation during disinfection of waters containing organophosphates.
Executive Summary
The Food Quality Protection Act (FQPA) of 1996 requires that all tolerances for pesticide chemical residues in or on food consider anticipated dietary exposure and all other exposures for which there is reliable information. Drinking water, in this case, is considered a potential pathway of dietary exposure for pesticides. Because drinking water for a large percentage of the population is derived from public water systems which normally treat water prior to consumption, the impact of water treatment on pesticide removal and transformation should be considered in drinking water exposure for risk assessments. Treated drinking water for the purpose of FQPA exposure assessment is defined as ambient ground or surface water that is either chemically or physically altered using technology prior to human consumption. The objectives of this document are to:
-
describe a review of available literature on the impact of different treatment processes on pesticide removal and transformation in treated drinking water derived from ground and surface water sources; and, based on the results,
-
describe a procedure for including a consideration of the impacts of drinking water treatment in drinking water exposure assessments developed for pesticides under FQPA.
The literature review in this document was originally developed and presented to a Federal Insecticide, Fungicide and Rodenticide Act (FIFRA) Scientific Advisory Panel (SAP) in 2000, who concurred with its conclusions. A document containing the literature review and a proposed methodology for incorporation of the effects of drinking water treatment into exposure assessments was made available to the public by United States Environmental Protection Agency (USEPA) as a draft in 2001. The current document incorporates comments received from the SAP and the public and finalizes the original document. The document has been modified to improve clarity and transparency; the content has not changed significantly.
In 1999, approximately 23 million people in the U.S. obtain their drinking water from private wells and other sources that undergo no treatment. For the remaining drinking water sources that are treated, available survey information establishes that there are many distinct types of water treatment processes (and many more combinations of processes) in use throughout the United States. Nearly all public water supply systems use some form of disinfection and a series of conventional treatment processes (coagulation-flocculation, sedimentation, and filtration). The processes that appear to have the most impact on pesticide removal - granular activated carbon (GAC) and powdered activated carbon (PAC) - are commonly found or used in larger water supply systems but, because of high costs, are rarely used by the smallest systems. Other methods, such as "softening," reverse osmosis, and air stripping, are also less frequently used to remediate water quality.
EPA's review of the literature indicates that conventional treatment (such as coagulation/flocculation, sedimentation, and filtration) has little or no effect on the removal of mobile (hydrophilic or lipophobic) pesticides. Disinfection and softening can facilitate alteration in the chemical structure of the pesticide, also called transformation. The type of disinfectant and its contact time with the pesticide are factors which affect pesticide transformation. There is often little information available on the chemical identity of transformation products formed as a result of disinfection. However, some studies document that disinfection can produce toxic by-products of some pesticides (e.g., oxons from organophosphates). The impact of softening on pesticide transformation is dependent on the potential for alkaline-catalyzed hydrolysis of the pesticide. The SAP evaluated the literature review conducted by EPA and concurred with the conclusions drawn by EPA (FIFRA SAP Historical meetings [September 2000]). The SAP also noted that immobile (hydrophobic/lipophilic) pesticides may be removed by conventional water treatment processes.
The Office of Pesticide Programs (OPP) utilizes the following approach for considering drinking water treatment effects on pesticide removal and transformation in FQPA pesticide risk assessments. Because most surface source drinking water receives some form of water treatment prior to human consumption, the process below is generally applicable to surface source drinking water. A similar assumption cannot be made for drinking water systems using ground water, in general, because of the importance of private wells in rural areas. Private wells are not generally linked to water treatment systems and, therefore, drinking water from this source is not treated prior to human consumption. This guidance is based on scientific conclusions reached as a result of OPP's literature review and on our assessment of the availability of information for specific pesticides on water treatment effects:
-
The Environmental Fate and Effects Division (EFED) will provide any available information on the potential and measured effects from drinking water treatment [e.g., flocculation, coagulation, sedimentation, filtration, chlorination, softening, granular activated carbon and powder activated carbon (GAC/PAC treatment)] to OPP's Health Effects Division (HED) Residues of Concern Knowledgebase Subcommittee (ROCKS). The ROCKS will evaluate this information and determine which, if any, transformation and degradation products might be of toxicological concern. This information may also be considered in FQPA Safety Factor decisions.
-
OPP will not conclude that treatment mitigates exposure for a specific pesticide without supporting evidence. Therefore, if sufficient pesticide-specific information is not available on effects of a water treatment processes, or if sufficient information is not available on the extent to which specific processes are employed within the pesticide use area, FQPA drinking water assessments will be conducted using pesticide concentrations in raw or ambient waters to represent pesticide concentrations in finished drinking water.
-
If sufficient pesticide-specific information is available on effects of a water treatment process, as well as information on the extent to which such a process is employed within the pesticide use area, EFED will attempt to describe quantitatively the potential effects of drinking water treatment for that pesticide in the drinking water assessment. This description will include effects of degradation and formation of transformation products. If the data are not robust enough to be used quantitatively, the drinking water exposure assessment developed will describe potential effects qualitatively.
-
Monitoring data on finished drinking water may also represent, in aggregate, the effects of water treatment in the study area. However, because of the inherent variability associated with water treatment processes and source water quality and the limited availability of monitoring data on pesticides in finished drinking water, extrapolating such results to areas outside of the area monitored will only be considered on a case-by-case basis. It is anticipated that quantification of drinking water treatment effects will be limited to pesticides with extensive monitoring data on finished water (e.g., atrazine) or pesticides with monitoring data on finished water from limited use areas (e.g., molinate). Even in those instances, the treatment effects may need to be addressed on a site-by-site basis. Extrapolating treatment effects across compounds with similar structures will be considered on a case-by-case basis.
-
Introduction
The FQPA of 1996 amended the Federal Food, Drug, and Cosmetic Act to require that all tolerances (maximum legal residues) for pesticide residues in or on food be "safe." The,term "safe" means that EPA has determined there is "a reasonable certainty of no harm" from aggregate exposure to the pesticide residue, including anticipated dietary exposure and all other exposures for which there is reliable information. Drinking water, in this case, is considered a pathway of potential dietary exposure for pesticides. OPP uses a variety of data, methods, and approaches to assess drinking water exposure for risk assessments completed under FQPA.
Generally, available monitoring data on pesticides in drinking water are limited to concentrations measured in raw or untreated water. OPP recognizes, however, that a large percentage of the population drinks water that has undergone some form of treatment, and where appropriate data allow, OPP considers the impact of drinking water treatment on potential human exposure. The objectives of this document are to:
-
describe a review of available literature on the impact of different water treatment processes on pesticide removal and transformation in treated drinking water derived from ground and surface water sources; and, based on the results,
-
describe a procedure for including a consideration of the impacts of drinking water treatment in drinking water exposure assessments developed for pesticides under FQPA.
-
1.1 Development of OPP Approach for Evaluating the Impacts of Drinking Water Treatment Processes in Drinking Water Exposure Assessments Developed under FQPA
In February 2000, the OPP solicited comments from a wide variety of internal and external peer reviewers on a preliminary literature review describing its assessment of water treatment effects on pesticide removal and transformation. Written comments indicated little disagreement with OPP's technical conclusions regarding removal efficiencies of various treatment technologies discussed in the literature review. After reviewing all of the technical peer review comments, OPP developed a revised background document and submitted it to the SAP for technical peer review in September 2000. The report of the SAP peer review (February 2001) concurred with OPP's technical conclusions. Following the SAP review and based on the scientific results from the literature review, OPP developed a procedure for evaluating the impacts of drinking water treatment processes in drinking water exposure assessments under FQPA. This document was provided for public comment on November 21, 2001. Comments received by OPP by the close of the comment period (January 22, 2002) supported the conclusions of the literature review and OPP's proposed procedure. These procedures were implemented in OPP in 2002. This document formally finalizes this approach, making modifications to improve its clarity and transparency.
-
1.2 Background
The FQPA of 1996 requires that all non-occupational routes of pesticide exposure be considered in aggregate and cumulative human health exposure assessments for pesticide tolerance reassessment. Because drinking water is a route of potential dietary exposure, it is factored into FQPA dietary exposure assessments. FQPA drinking water exposure assessments are based on screening models [e.g.,FQPA Index Reservoir Screening Tool (FIRST), Screening Concentration In GROund Water (SCI-GROW), and Pesticide Root Zone Model (PRZM)/EXposure Analysis Modeling System (EXAMS)], as well as on pesticide occurrence data in ambient waters [e.g., NAtional Water Quality Assessment (NAWQA) monitoring data], and appropriate pesticide occurrence data in drinking water, such as compliance monitoring data. Treated drinking water for the purpose of FQPA exposure assessment is defined as ambient ground or surface water that is either chemically or physically altered using technology prior to human consumption. As a potential refinement to FQPA drinking water exposure assessments, water treatment effects, including both pesticide removal and transformation, need to be considered and appropriately factored into the aggregate human health risk assessment process under FQPA.
Assessment of the impacts of drinking water treatment processes on the level of pesticide concentrations in ambient water and the resulting levels in treated water requires an understanding of the removal efficiency for various pesticides and treatment processes, as well as an understanding of the spatial and temporal distribution of treatment systems within potential pesticide use areas. Assessment of treatment processes is further complicated because each water treatment system is uniquely designed to accommodate local water quality conditions (levels of organic, inorganic, and biological contaminants), the number of persons served, and economic resources.
-
1.3 Regulation of Pesticides under the Safe Drinking Water Act (SDWA)
Drinking water from community water systems (CWSs) and non-community water systems (NCWSs) is regulated under the Safe Drinking Water Act. Based on this law, as of 2010, maximum contaminant levels (MCLs) have been established by EPA for 79 contaminants, including 24 pesticides, some of which are no longer approved for use. The MCL for each contaminant is based on a consideration of the best available technology (BAT) as well as occurrence and human exposure, health effects and toxicity, analytical methods, and economics. The MCL (an enforceable entity) is established to be as close to the maximum contaminant level goal (MCLG; a non-enforceable entity) as feasible. As of July 2010, there are 13 MCLs for currently registered pesticides.
The SDWA requires disinfection of all public water supplies and establishes criteria of filtration requirements for public water supplies derived from surface water. Additionally, the Surface Water Treatment Rule of 1989 (SWTR) requires all public water systems using surface water or ground water under the influence of surface water to disinfect drinking water. Systems may be required to filter their water if certain water quality criteria (e.g., turbidity, removal of Giardia cysts and viruses, compliance with total trihalomethane MCL) and site-specific objectives (watershed control program) are not met. In 1991, the criteria of SWTR were amended to include removal of Cryptosporidium. These regulations serve to establish the baseline treatment processes for public water systems (PWSs).
The 1996 amendments to the SDWA were designed to focus on small system treatment technologies (USEPA, 1998). The amendments were designed to:
-
identify technologies that small systems (those serving populations of 10,000 or fewer people) can use to comply with the SWTR and National Primary Drinking Water Regulations (NPDWR);
-
identify BATs for larger systems; and
-
evaluate emerging technologies as potential compliance or variance technologies for both existing and future regulations.
Small treatment systems, as defined in the 1996 amendment of SDWA, serve populations of 10,000 or fewer people.
Granular activated carbon (GAC) under the SDWA is the BAT for removing synthetic organic chemicals (SOC); the majority of pesticides are SOCs. Other recommended BATs are aeration technologies for removal of dibromochloropropane and chlorination or ozonation for removal of glyphosate.
The Disinfectants/Disinfection By-Products Rule (D/DBP) was finalized in 1998. The rule deals with the halogenated compounds generated during disinfection or chlorination of raw waters with dissolved organic matter (humic acids, fulvic acids, etc.). Maximum residual disinfectant limits (MRDLs) have been set and allowable levels of disinfection by-products, such as trihalomethanes, haloacetic acids, haloketones, haloacetonitriles, etc., were established. In a similar fashion, the European Union (EU) has issued the Drinking Water Directive of 1998 that sets a maximum concentration of 0.0001 mg/L for individual pesticides or degradation products and 0.0005 mg/L for total pesticide residues in drinking water after treatment (Acero et al., 2000).
Under the current SDWA, allowable levels of some pesticides should not exceed their MCLs. These MCLs are established to be protective of human health and must be "feasible." Feasibility is determined by BAT removal efficiency, levels of contaminants in raw water, water quality parameters, and the contaminant concentrations that can be accurately quantified analytically. The MCLs of the 13 currently registered pesticides are listed in Table 1.
Table 1
Currently Registered Pesticides with MCLsPesticides MCL (µg/L) Atrazine 3 Alachlor 2 Carbofuran 40 2,4-D 70 Dichlorobenzene 75 Diquat 20 Endothall 100 Glyphosate 700 Methoxychlor 40 Oxamyl 200 Pentachlorophenol 1 Picloram 500 Simazine 4 -
-
-
Literature Review of the Impacts of Water Treatment Processes on Pesticide Removal and Transformations in Drinking Water
In its literature review, OPP reviewed Agency documents, including EPA research articles and publications, basic textbooks on water treatment, and publications in the open literature as well as information obtained through personal communication with experts. This information was then summarized in tabular form to highlight the removal efficiencies associated with different treatment processes and different methods used to estimate removal efficiencies. The primary methods included bench-scale studies (jar tests), pilot-plant studies, and full-scale treatment operations that used distilled water, surface water, and ground water as raw water. The pesticide removal efficiencies were quantitatively analyzed based on the levels of pesticides, before and after treatment, although the majority of these treatment operations in the studies were not designed to remove pesticides.
When available, data on the chemical transformation of pesticides in certain treatment operations were reported. Pesticide transformation products would not be typically expected from treatment processes involving phase separations such as flocculation and sedimentation. However, chemical transformation of pesticides would be expected from chemical or biochemical reactions resulting from addition of acidic or basic compounds, biochemically mediated transformations, and treatment chemicals that alter the reduction/oxidation (redox) potential of the systems under consideration.
-
2.1 Water System Statistics
Under the SDWA, a PWS is any system that provides water for human consumption through water pipes or has at least 15 service connections or regularly serves an average of at least 25 people individuals daily for 60 days in the year. A PWS is either a CWS or NCWS. Non-transient non-community water systems are defined as water systems that serve less than 25 of the same people for at least a six-month period. An example of non-transient community water system is a well serving a school or hospital. Transient non-community water systems are water systems that do not regularly serve at least 25 of the same people over a six month period. An example of a non-transient non-community water system is a well serving a campground or roadside rest area.
In 1999, approximately 23 million people in the United States obtain their drinking water from sources other than public water systems. The remaining 252 million people in the United States obtain their drinking water from CWSs, with 84 million people relying solely on ground water-based systems and about 168 million people relying on surface water in part or in whole (Personal Communication with Chuck Job USEPA/OW, 2000). In general, CWSs are regulated under the SDWA and are required to meet certain standards. This means that these systems generally use some form of water treatment, particularly for surface water, prior to distribution into homes and businesses.
Typically, the sophistication of the water treatment technology is dependent on the population served, type of source water, and physical-chemical properties of the source water (USEPA, 1997a). These factors are discussed in the following sections.
-
2.1(a) Population Served (Size of Water Treatment Facilities)
The size of CWSs is expected to be dependent on the water demand or population served. Based on the 1995 CWS survey (USEPA, 1997b), 85% of CWSs are small systems serving 3,300 or fewer people. Medium (serving 3,301 to 50,000 people) and large (serving > 50,000 people) CWSs account for only 13% and 2% of CWS systems, respectively. Although these medium and large systems represent only 15% of the number of CWS, they are responsible for serving approximately 90% of the population.
-
2.1(b) Types of Water Treatment Associated with Different Source Waters
The percentage of CWSs not using water treatment technologies has decreased between the years 1976 and 1995 (USEPA, 1997a). CWSs not using water treatment typically are very small CWSs (serving < 500 people) using surface water or small to medium size CWSs using ground water (USEPA, 1998). Although there are CWSs larger than very small ones (serving more than 500 people) using ground water with no water treatment, they represent a relatively small percentage (0.9 to 16% of systems) of the CWS systems. With the exception of the very small CWSs (serving < 500 people) using surface water, all CWSs withdrawing from surface water are using some type of water treatment. This trend may be attributed to EPA's promulgation of the Surface Water Treatment Rule of 1989.
The 1995 Community Water System Survey identified approximately 38 different water processes for water systems using mixed source waters. Water treatment is mainly established for the following purposes:
- disinfection,
- sediment removal,
- organic removal, and
- corrosion control.
Disinfection is the most common treatment process for CWSs using only ground water (Table 2). The predominant treatment processes for CWSs using surface water are disinfection/ oxidation, flocculation/coagulation, and conventional (sand or gravel) filtration (Table 3). Water systems using a mixture of ground and surface waters generally use similar treatment technologies as are used for the predominant source water type (USEPA, 1997a). Control of turbidity is the main difference in treatment strategies for CWSs that use either surface water or surface water/ground water.
Table 2
Percent of Ground Water Systems with Treatment1Treatment Category Population Category (Number of People Served) Less than 100 101-500 501-1,000 1,001-3,000 3,301-10,000 10,001-50,000 50,001-100,000 More than 100,000 Disinfection 52.8 77.9 84.0 79.7 86.8 96.5 86.3 96.4 Aeration 1.5 6.3 17.1 19.9 29.7 33.0 49.1 44.1 Oxidation 3.2 6.6 9.4 4.2 10.9 9.3 18.6 5.4 Ion Exchange 0.7 1.6 3.8 1.9 4.6 3.3 1.2 0 Reverse Osmosis 0 1.2 0 0.9 1.2 0.7 1.2 0 GAC 0 0.5 0 0.4 0 6.7 7.5 9.0 PAC 0 0 0 0 0.2 0.3 0 1.8 Filtration 11.8 8.0 15.9 14.9 29.5 29.6 50.3 51.4 Coagulation/Flocculation 1.5 5.4 4.2 3.4 8.1 15.1 24.2 25.2 Lime/Soda Ash Softening 2.1 3.7 4.1 5.2 7.0 12.2 17.4 32.4 Recarbonation 0 0.5 0 1.1 3.0 6.1 7.5 10.8 1 Data taken from SAIC, 1999
Table 3
Percent of Surface Water Systems with Treatment1Treatment Category Population Category (Number of People Served) Less than 100 101-500 501-1,000 1,001-3,000 3,301-10,000 10,001-50,000 50,001-100,000 More than 100,000 Disinfection 92.8 94.1 100 100 96.0 98.0 100 100 Aeration 0 0 1.4 5.5 8.5 3.5 10.3 14.3 Oxidation 0 2.0 7.2 5.8 7.7 10.5 5.7 4.6 Ion Exchange 0 0 0 0 0 0 0 0 Reverse Osmosis 0 0 0 0 0 0 0 0 GAC 3.9 4.3 1.4 2.3 4.7 10.2 14.9 11.2 PAC 0 2.0 3.0 4.6 18.6 24.6 34.2 45.9 Filtration 78.5 71.2 79.3 81.7 86.5 96.3 88.0 93.4 Coagulation/Flocculation 27.5 52.6 70.2 78.5 95.4 94.5 93.7 99.5 Lime/Soda Ash Softening 3.9 8.1 20.5 17.5 10.8 6.9 5.7 5.1 Recarbonation 0 0 0 0 0 0 1.1 5.1 1 Data are taken from SAIC, 1999
Water treatment in PWSs consists of a sequence of individual treatment processes. Conventional treatment, defined as a sequence of processes typically used in water treatment, may include the following treatment processes: clarification (sedimentation), filtration, softening, recarbonation, and chlorination (Miltner, et al., 1989). The selection of treatment processes to be used at a given PWS, however, is dependent on several factors, including seasonal changes/requirements, water quality, watershed properties, population served, and economics. Therefore, water treatment processes at each PWS consist of a unique set of processes that cannot be generalized or exactly replicated. Disinfection/oxidation processes, for example, can vary with regard to the selection of disinfectant and the location of disinfection process in the water treatment process; and may depend on turbidity of source water, and the nature and presence of organic and inorganic contaminants. Modification of any variable in the disinfection process can drastically alter the efficiency of the process, as well as the production of by-products in finished water. The chemical and physical engineering of sequential water treatment processes needs to be considered in assessing pesticide removal and transformation.
-
-
2.2 Water Treatment Assessment Techniques
Water treatment assessment approaches fall into three basic categories:
- relational (regression modeling),
- experimental (prototype studies), and
- actual field monitoring.
The relational or correlative approach relies on regressing pesticide removal for a specific process to environmental fate properties of pesticides. The pesticides whose removal rates have been reported in the literature do not have sufficiently variable properties to develop regression equations that apply to a wide range of chemicals. Therefore, OPP's analysis could not establish any clear relationship or trend between the ability of a specific water treatment process to reduce the concentration of a pesticide in water, and the environmental fate and characteristics of the pesticide.
Prototype studies are the standard approach to assess and optimize water treatment processes (JMM, 1985; USEPA, 1989). The most common approach is the bench-scale laboratory study commonly referred to as a "jar" study. A jar study is a static mixed reactor system (mixed water in a jar). Although there is no standard test protocol for jar studies, a standard protocol has been proposed by Lytle, 1995. The test study is recommended to assess the impact of primary water treatment processes, including coagulation, flocculation, and sedimentation (JMM, 1985). Jar tests are also recommended for assessing turbidity removal, appropriate dose of coagulants, impact of polymeric aids, impact of mixing time, and control measures for iron and manganese precipitation (JMM, 1985). Advantages of jar studies are the relative ease and low costs associated with the method. One of the disadvantages of jar tests as a method for determining impacts of conventional drinking water treatment on the levels of pesticides in finished water is that they typically do not permit evaluation of how characteristics of the raw source water (e.g., turbidity or pesticide concentration), which vary both temporally and spatially, may affect the ability of the water treatment process to reduce pesticide concentrations (Lytle, 1995). Another disadvantage of jar studies is that they do not evaluate the combination of treatment processes operating at a plant-scale.
More refined prototype studies are pilot-scale and plant-scale studies. These types of studies are recommended for assessing filtration processes (JMM, 1985). Filtration variables evaluated using pilot-scale studies are as follows:
- filter media size,
- bed depth,
- filter media type,
- filtration rates, and
- filter washing conditions.
Other specialized studies can be conducted to assess specific treatment issues, including volatile organic carbon (VOC) removal using packed towers, air loading rates in air stripping, disinfectant dose and type, or evaluation of adsorption from GAC. The actual scale of the special studies should be commensurate with simulation of full-scale water treatment processes (JMM, 1985).
Actual monitoring at water treatment plants is conducted for regulatory and research purposes. In these monitoring studies, raw source water is analyzed at the water system intake and in finished drinking water. The major advantage of this approach is that the whole water treatment process is evaluated rather than an individual process. A disadvantage of water plant monitoring is the difficulty in conducting precise temporally-paired raw and finished water sampling. This type of sampling is required to estimate removal or transformation efficiencies. Also, an assessment on the impact of individual treatment processes within the water plant requires paired sampling before and after each treatment step.
-
2.3 Water Treatment Processes and Removal Efficiencies
-
2.3(a) Conventional Treatment
A typical system for surface water treatment generally consists of pre-settling, coagulation/flocculation (sediment removal), granular filtration (sediment removal), corrosion control (pH adjustment or addition of corrosion inhibitors), and disinfection (JMM, 1985; Faust and Aly, 1999; USEPA, 1989). It is important to note that there are many variations on this common sequence with regards to points of addition of a wide variety of chemicals (e.g., chlorine, ammonia, ozone, coagulants, filter aids, PAC, etc.). The pre-settling process is a preliminary removal of materials, including non-colloidal sediment, from the raw water. The water is then treated with alum and polymers to encourage flocculation of the colloidal materials, including suspended sediment, and then allowed to settle. Next, the water is passed through a granular filter comprised of sand and possibly anthracite. After filtering, the water is conditioned to prevent corrosion and then disinfected using either chlorine or chloramines.
A modification to the typical treatment process is the use of GAC or PAC for the control of odors and taste in the finished water. This modification is applied through the filtration process either through the formation of a filtration bed using GAC or through the addition of PAC prior to coagulation/flocculation and filtration.
-
2.3(a)1 Coagulation/Flocculation
Coagulation and flocculation is a two-step process to remove inorganic and organic colloidal materials from water (JMM, 1985). Colloidal materials are particles that are so small (less than 10 µm) that they stay suspended in the water. They often have charged surfaces that cause them to repel each other. The coagulation process neutralizes the colloid's surface charge, which is then followed by mixing, and eventually causes flocculation (the joining of individual particles) of the colloids into aggregates called "flocs". The flocs are then large enough to settle from the water column. This coagulation process is needed to remove turbidity (inorganic colloids) and color (organic colloids). Removal of organic colloids such as humic and fulvic acids is critical because they are known precursors to the formation of disinfection by-products (e.g., trihalomethanes) when chlorine is added.
Commonly used coagulants are inorganic salts [e.g., alum (Al2(SO4)3), aluminum chloride (AlCl3), ferric sulfate (Fe2(SO4)3), and ferric chloride (FeCl3)]. Certain organic polymers are also used. Inorganic salts are effective coagulants because Al+3 and Fe+3 hydrolyze to form positively charged hydrolysis species for neutralization of the surface charge for colloid destabilization. Additionally, these ions hydrolyze to form amorphous hydroxides, Al(OH)3 and Fe(OH)3, which cause physical aggregation through colloid entrapment. The time required for coagulation/flocculation to occur is a critical factor. Typically, coagulation and sweep floc formation is rapid (0.5 to 30 seconds). Water is typically held in a flocculation basin for 15 to 45 minutes (USEPA, 1989). The optimum pH for coagulation is about 6.5 (JMM, 1985 and USEPA, 1989). A higher pH (e.g., above 8) will result in dissolution of the Al(OH)3 flocs. Recommended alum dose rates range from 5 to 150 mg/L (USEPA, 1989). Natural and synthetic polymers are also used to form different charges (cationic and anionic) for neutralization of various surface charges. Cationic (positive charge) polymers are generally used as primary coagulants. Typical polymer dosages range from 1.5 to 10 mg/L (USEPA, 1989). Nonionic and anionic polymers are used to strengthen flocs, and they can be added as alum at polymer ratios ranging from 100:1 to 50:1 (USEPA, 1989). Jar tests are recommended to evaluate coagulant doses.
Organic compounds potentially removed through coagulation/flocculation are hydrophobic, have low molecular weight acidic functional groups (e.g., carbonyl and carboxyl functional groups), or are high molecular weight compounds (USEPA, 1989). Coagulation processes have been developed to take advantage of adsorption on surfaces of Al(OH)3 and Fe(OH)3 flocs (USEPA, 1989). EPA recommendations include:
-
Acidification
Add acid prior to coagulant addition to encourage cationic species formation and sorption on colloid surfaces,
-
Flocculation
Addition of anionic polymer after the coagulant addition,
-
Adsorption Process
Addition of powdered activated carbon to, or with, the addition of coagulant for organic removal.
Miltner et al., (1989) provided information on the possible removal of pesticides with conventional treatment. In this study, three triazine pesticides (atrazine, simazine, and metribuzin), two acetanilides (alachlor and metolachlor), linuron, and carbofuran were spiked into Ohio River water in jar tests. The initial concentrations of the pesticides (C0), as shown in Table 4, ranged from 34.3 to 93.4 µg/L. After alum coagulation [Al2(SO4)3·14H2O: 15-30 mg/L], the initial turbidity of the raw water (6 - 42 Nephelometric Turbidity Units (NTU)) dropped to less than 1 NTU in the settled water. Table 4 summarizes the data obtained on the possible removal of the eight pesticides during alum coagulation. No removal of the triazine pesticides, linuron, and carbofuran was observed. The removal of alachlor and metolachlor was low and ranged from 4 to 11 % percent.
Table 4
Removal of Pesticides by CoagulationPesticide Coagulant (dose, mg/L)* Initial Concentration (µg/L) % Removal Atrazine Alum (20) 65.7 (SW)* 0 Simazine Alum (20) 61.8 (SW) 0 Metribuzin Alum (30) 45.8 (SW) 0 Alachlor Alum (15) 43.6 (SW) 4 Metolachlor Alum (30) 34.3 (SW) 11 Linuron Alum (30) 51.8 (SW) 0 Carbofuran Alum (30) 93.2 (SW) 0 From Miltner et. al., 1989
* SW = surface water
-
-
2.3(a)2 Softening
Water softening is used to lower the water hardness, which is represented by the summation of calcium (Ca2+) and magnesium (Mg2+) concentrations in water. Hardness reduces the effectiveness of soaps and detergents, and hard water often leaves films and deposits on surfaces in contact with it. The recommended hardness of drinking water can range from 50 to 150 mg/L (JMM, 1985). Water softening can be achieved by precipitation of Ca2+ and Mg2+ or by ion exchange. Precipitation of CaCO3 and Mg(OH)2 requires adjusting the pH to between 9.3 and 10.5 using either lime or caustic soda (NaOH). After precipitation, the water pH is lowered using recarbonation (dissolving CO2 in water). Ion exchange using cation exchange resins is another technique used in water softening.
The process of softening or softening-clarification was evaluated for its ability to remove pesticides from water. Data collected from the full-scale treatment plants indicated that atrazine, cyanazine, metribuzin, alachlor and metolachlor at initial concentrations in the parts per billion level (µg/L) were not removed during the softening-clarification process (Table 5). In contrast, studies show that 100% of parent carbofuran was removed. During softening, when the pH of the solution reached between 10 and 11, alkaline hydrolysis of carbofuran could have taken place, especially if there was sufficient detention or contact time. However, no analysis of degradation products was reported. Based on environmental fate data from EPA/OPP (USEPA, 1989) and Nanogen International (1975), carbofuran hydrolyzes under alkaline conditions to form carbofuran-7-phenol and 3-hydroxycarbofuran.
Table 5
Removal of Pesticides Associated with Softening-Clarification at Full-Scale Treatment PlantsPesticide Initial Concentration (µg/L) % Removal Atrazine 7.24 0 Cyanazine 2.00 0 Metribuzin 0.53 - 1.34 0 Simazine 0.34 0 Alachlor 3.62 0 Metolachlor 4.64 0 Carbofuran 0.13 - 0.79 100 From Miltner et. al., (1989)
-
2.3(a)3 Sedimentation
Sedimentation is effective in removing materials and particulates with densities greater than water (1 g/cm3) (JMM, 1985), which settle out under the influence of gravity. Sedimentation in the water treatment process occurs following flocculation and generally precedes filtration. Additionally, sedimentation may occur in retention basins before water enters the water treatment plant. No data were available or reviewed to assess the effectiveness of sedimentation on pesticide removal and transformation.
-
2.3(a)4 Filtration
Filtration is considered an integral step in the water treatment process for particulate removal, including microorganisms (Giardia lamblia), algae, colloidal humic compounds, viruses, asbestos fibers, and suspended clays (JMM, 1985). Conventional filtration has been defined as "a series of processes including coagulation, flocculation, sedimentation, and filtration resulting in particulate removal" (40 CFR 141.2). For this paper, filtration is defined as "a process of particulate removal, through interaction with filter media, either through straining or non-straining mechanisms" (JMM, 1985). Filters can be made using screens (e.g., polyethylene, stainless steel, and cloth), diatomaceous earth, and granular materials (e.g., sand, anthracite coal, magnetite, garnet sand, and ground coconut shells). These filters can effectively remove particulate materials with diameters of up to 10 mm. Coagulation-flocculation generally precedes sedimentation, which precedes filtration. This sequence of treatments is common in conventional water treatment processes. Water flow through filters can be controlled by gravity (granular filters) or under pressure (diatomaceous earth filters). Factors impacting filter efficiency are related to the particulate size, granular size distribution, filtration rate, surface properties of the filter, and head pressures (JMM, 1985, USEPA, 1989). No data were reviewed to assess the effectiveness of filtering (except GAC) on pesticide removal and transformation. Other filter configurations may include filter adsorption (e.g., capping a sand filter with GAC) or post-filter adsorption (e.g., separate GAC beds after sand filtration).
-
-
2.3(b) Disinfection/Chemical Oxidation
Disinfection is the process of inactivation or destruction of pathogens (e.g., bacteria, amoebic cysts, algae, spores, and viruses) in water (JMM, 1985). Disinfection also has the potential to remove or transform some pesticides through oxidation. Inactivation or destruction of pathogens occurs through chemical oxidation of cell walls or other mechanisms. Chemical disinfectants listed in sequential order from highest to lowest oxidation potential are ozone (O3), chlorine dioxide (ClO2), chlorine (Cl2), and chloroamines (JMM, 1985 and USEPA, 1989). Other advanced oxidation processes (AOP) are ozone (O3)-hydrogen peroxide (H2O2), ultraviolet (UV)-O3, O3 at high pH (pH > 8), or potassium permanganate (KMnO4) (USEPA, 1989). Physical disinfection processes utilize UV, which encourages photodegradation of nucleic acids in microorganisms (USEPA, 1989). This process is conducted at wavelengths ranging from 250 to 270 nm (USEPA, 1989).
Primary disinfection occurs prior to or during the water treatment process and frequently involves the use of chlorine, O3, and ClO2. The target dose rate for chlorination is the achievement of a maximum free chlorine concentration (hypochlorous acid + hypochlorite) of 1 mg/L (USEPA, 1989). Secondary disinfection is used to establish residual concentrations of disinfectants in drinking water and frequently involves the use of monochloramine and chlorine. Although the order of oxidation potential generally describes the effectiveness of the disinfectant (e.g., a high oxidation potential is highly effective), the kinetics of oxidation can alter the relative effectiveness of disinfectants. The effectiveness of chemical disinfection is also dependent on water quality (including turbidity, quantity and types of organics, pH, and temperature), contact time, and application time in the water treatment process (JMM, 1985 and USEPA 1989).
Water quality is an important factor in controlling disinfectant effectiveness as well as formation of by-products. The pH of the water is critical in controlling the distribution of the active chlorine species (hypochlorous acid) and hydroxyl radicals from ozone (JMM, 1985 and USEPA, 1989). Water turbidity is important in determining the disinfectant dose as well as the amounts and kinds of disinfection by-products. Water high in turbidity requires a higher disinfectant concentration because of the presence of particulates. In determining the disinfectant dosage, bench-scale studies, such as jar tests, are recommended.
A major consideration in chemical disinfection is the formation of disinfection by-products. Maximum concentrations of disinfection by-products are expected when there are high concentrations of organic compounds or when there is long contact time with the disinfectant (JMM, 1985 and USEPA, 1989). Water treatment processes that remove natural or synthetic organics prior to disinfection are expected to minimize disinfectant by-product concentrations in drinking water due to removal of precursor materials. Halogenated disinfection by-products are expected from chlorine and chlorine dioxide (USEPA, 1989), while chloroamines are not expected to form comparable quantities of disinfection by-products when compared to chlorine. Ozone is recommended as an alternative disinfectant to reduce the concentrations of disinfectant by-products (AWWA Water Quality and Treatment Handbook).
In laboratory studies conducted by Miltner et al. (1987), different oxidants were tested for their ability to remove alachlor in water. The oxidants were O3, Cl2, ClO2, H2O2, and KMnO4. Table 6 shows the chemical oxidation results for alachlor removal using different doses of the oxidants, alachlor concentration, and contact time. In this study, only ozone was found to remove alachlor, with removal efficiencies ranging from 75% to 97% for distilled water, ground water and surface water. The remaining oxidants such as ClO2, H2O2, and KMnO4 were largely ineffective in removing alachlor in distilled water samples. In surface water samples, low removal efficiencies were exhibited by Cl2 and ClO2.
Table 6
Removal of Alachlor by Chemical OxidationOxidant Oxidant dose
(mg/L)Alachlor Concentration
(µg/L)Contact Time
(Hr)% Removal Ozone 6.9 139 (DW)* 0.22 95 2.6-9.3 145 (GW)** 0.22 79 - 96 2.3-13.7 0.39 - 5.0 (SW)*** 0.22 75 - 97 Chlorine 4.0-6.0 31-61(SW) 2.5 - 5.83 0-5 ClO2 3.0 61 (SW) 2.5 9 10.0 58 (DW) 22.3 0 H2O2 10.0 58 (DW) 22.3 0 KMnO4 10.0 58 (DW) 22.3 0 * From Miltner et al., 1987
* DW = distilled water** GW = Ground water
*** SW = Surface water
The oxidation of glyphosate (herbicide) by different disinfection chemicals from pilot-plant studies was reported by Speth (1993). In these studies, the glyphosate concentration (796 µg/L) was reduced by chlorine (2.1 mg/L) after 7.5 minute contact time to below detection limits (< 25 µg/L). Another oxidant, ozone, was found to destroy glyphosate (840 to 900 µg/L) within 5 to 7 minutes at applied dosages of 1.9 and 2.9 mg/L. Treatments with ClO2, KMnO4 and H2O2 were less successful in glyphosate oxidation.
The effect of chlorination on pesticides was also evaluated at full-scale treatment plants in Ohio (Miltner et al., 1989). Three treatment plants in Tiffin District, Fremont, and Bowling Green, Ohio, generally used up to 13 mg/L Cl2 (especially during runoff season) and provided in-plant contact time of less than 12 hours. The percent removal data for those pesticides initially present at parts per billion (µg/L) levels are summarized in Table 7. For atrazine, cyanazine, simazine, alachlor, metolachlor, and linuron, the removal efficiencies were either zero or extremely low. Some removal (24 %) was observed for carbofuran, and up to 98 % removal was reported for metribuzin. However, according to the investigators, this high removal efficiency for metribuzin may be partly attributed to sample preparation in which no reducing agent was added to stabilize the samples. Thus, it was possible that chlorination could have continued for days prior to analysis of the collected samples.
Table 7
Removal of Pesticides Associated with Chlorination at Full-Scale Treatment PlantsPesticide Initial Concentration (µg/L) % Removal Atrazine 1.59 - 15.5 (SW) 0 Cyanazine 0.66 - 4.38 (SW) 0 Metribuzin 0.10 - 4.88 (SW) 24 - 98* Simazine 0.17 - 0.62 (SW) 0-7 Alachlor 0.94 - 7.52 (SW) 0-9 Metolachlor 0.98 - 14.1 (SW) 0-3 Linuron 0.47 (SW) 4 Carbofuran 0.13 (SW) 24 From Miltner et al. (1989)
* Metribuzin removal may be the result of sample storage without oxidant quenching. Similar removals in water treatment plants may not be expected.
SW = surface water
-
2.3(c) Carbon Adsorption
Adsorption water treatment processes are predominately used for control of taste and odor, as well as for removing synthetic organic compounds, toxic metals, and chlorine. Sorption is a process of reversible physicochemical binding of the substance on the sorbent (e.g., colloid or activated carbon). Mechanisms controlling sorption are dependent on physical processes such as electrostatic attraction [dipole-dipole interactions, dispersion interactions (van der Waals forces), and hydrogen bonding] or chemisorption (JMM, 1985). Non-linear equilibrium models such as the Langmuir and Freundlich models have been used to predict adsorption potential of organic contaminants. Compounds with a high Freundlich coefficient were found to have sorption affinity to activated carbon.
GAC and PAC are common sorbents. Activated carbon is composed of expanded layers of graphite, which leads to an extremely high surface area to mass ratio for sorption (JMM, 1985). Other less common sorbents are activated aluminum, silica gel, synthetic aluminosilicates, polymeric resins, and carbonized resins. The main difference between GAC and PAC is the particle size; PAC has smaller particles when compared to GAC. GAC is used as filter adsorption for taste and odor control, and post-filter adsorption units are designed for synthetic organic removal. In contrast, PAC is added within conventional treatment systems before or during the coagulation/flocculation and sedimentation treatment process.
The adsorption capacity of activated carbon to remove pesticides is affected by concentration, temperature, pH, competition from other contaminants or natural organic matter, organic preloading, contact time, mode of treatment, and physical/chemical properties of the contaminant. GAC column effectiveness is also a function of the water loading rate and empty bed time, whereas PAC effectiveness is also a function of the carbon dosage. Generally, activated carbon has an affinity for contaminants that are hydrophobic (low solubility) although other parameters such as density and molecular weight can be important.
Isotherm constants have been reported to be valuable for predicting whether activated carbon adsorbs a particular pesticide (Speth and Miltner, 1998; Speth and Adams, 1993). The authors of these studies reported that, in general, compounds with Freundlich coefficients on activated carbon of greater than 200 µg/g (L/µg)1/n would be amenable to removal by carbon sorption.
-
2.3(c)1 Powdered Activated Carbon (PAC)
Miltner et al. (1987, 1989) studied the removal of atrazine and alachlor using PAC. PAC doses were selected to reflect the range commonly used by PWSs for taste and odor control. Both jar and full-scale treatment tests conducted using surface water samples containing other synthetic organic contaminants indicated that atrazine and alachlor could be adequately adsorbed to activated carbon. The observed removal was attributed to adsorption because previous studies indicated that conventional treatment was ineffective in removing these pesticides in the raw water. Table 8 summarizes the doses, PAC types (WPH Calgon and Hydrodarco), water source, and mean concentrations of the two pesticides. The percent removal ranged from 28% to 87% for atrazine and 33% to 94% for alachlor. For similar water sources, as the PAC dose increased, sorption removal efficiencies remained the same or increased.
Table 8
Removal of Atrazine and Alachlor Using PAC During Full-Scale TreatmentPAC*
(dose, mg/L)Water Source** C0 (µg/L) % Removal Atrazine Alachlor Atrazine Alachlor WPH (2.8) Sandusky River (C) 7.83 1.67 28 33 WPH(3.6) Sandusky River (C) 2.61 1.49 38 36 WPH (8.4) Sandusky River (R) 12.05 2.84 35 41 WPH (11) Sandusky River (R) 4.43 2.53 41 41 HDB (18) Maumee River (R) 8.11 8.21 67 62 HDB (33) Maumee River (R) 2.39 0.97 87 94 From Miltner et al., 1987 and Miltner et al., 1989.
* PAC type: WPH = WPH Calgon and HDB = Hydrodarco, ICI, America
** (C) = Clarified Water; (R) = Raw Water
The PAC dose required to reduce the pesticide concentration to a predetermined value in a jar test using distilled water could be different from the dose required to reduce pesticides in natural water in a treatment plant. The difference could be attributed to the presence of other solutes and treatment chemicals in natural water, which can compete with the pesticides for sorption sites. Figure 1 shows that the activated carbon adsorptive capacity for parathion, 2,4,5-T ester, lindane, and dieldrin in Little Miami River water (plant test) is more than 50% lower than it is in distilled water (jar test) (Najm et al., 1991).
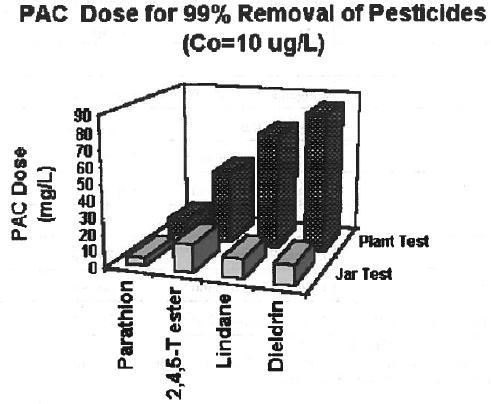 Figure 1
PAC Doses Required to Remove 99% of the Pesticide from Jar and Plant Tests
Initial concentration of each pesticide is 10 µg/L (Data from Najm et al, 1991).
Jar Test: PAC dose in jar tests (distilled water) determined after 1-hour contact time.
Plant Test: PAC dose in plant test (river water) determined using conventional treatment and activated carbon. -
2.3(c)2 Granular Activated Carbon (GAC)
Like PAC, GAC is also known for adsorbing a wide variety of organic compounds and pesticides. The performance of GAC in removing pesticides from raw water has been demonstrated by the studies of Miltner et al. (1989), who used pesticides belonging to the triazine, acetanilide, and dinitroaniline classes. The carbon was in operation for 30 months before sampling. As shown in Table 9, relative to the initial concentrations of the pesticides, the percent removal of the two acetanilide pesticides (72 - 98%) was higher than those of the triazine pesticides (47 - 62%). The highest removal efficiency (> 99%) was reported for pendimethalin.
Table 9
Removal of Pesticides by Granulated Activated Carbon AdsorptionPesticide Class Pesticide GAC C0 (µg/L) % Removal Triazine Atrazine Calgon Filtrasorb 300®* 4.83 (SW)+ 47 Cyanazine Calgon Filtrasorb 300®* 1.62 (SW)+ 67 Metribuzin Calgon Filtrasorb 300®* 0.89 (SW)+ 57 Simazine Calgon Filtrasorb 300®* 0.39 (SW)+ 62 Acetanilide Alachlor Calgon Filtrasorb 300®* 3.70 (SW)+ 72 Metolachlor Calgon Filtrasorb 300®* 5.60 (SW)+ 56 Pendimethalin (dinitroaniline) Calgon Filtrasorb 300®* 0.20 (SW)+ > 99 From Miltner et al., 1989 & Milner et al., 1987
* 30 month-old carbon, bed depth = 1.5 ft, loading = 4 gpm/ft3, EBCT = 2.81 min.
+ SW=clarified Sandusky River water (Surface Water)
Based on the data of Miller and Kennedy (1995) for two triazine herbicides and a transformation product in reservoir and drinking waters, activated carbon treatment actually employed in different municipalities could produce mixed results. As presented in Table 10, GAC adsorption in Creston, Lake Park, and Osceola, Iowa, decreased the concentrations of atrazine, cyanazine, and desethylatrazine in the treated water. In Fairfield, though, cyanazine was detected in the drinking water (close to detection limit), but was not found in the reservoir water. In Lake Park, desethylatrazine was detected in the drinking water, but not in the reservoir water. It is difficult to know whether the results for Fairfield and Lake Park are somehow related to sampling and analytical deficiencies or possible breakthrough of cyanazine and desethylatrazine from the GAC column. The sampling time and schedule for the reservoir and drinking waters also need to be considered in these studies.
Table 10
Water Supply Sources Treated with GAC and Herbicide Concentrations in Drinking WaterCity/Town Water Supply Source Atrazine (µg/L) Cyanazine (µg/L) Desethylatrazine (µg/L) Drinking Water Reservoir Water Drinking Water Reservoir Water Drinking Water Reservoir Water Creston Twelve Mile Lake 0.35 0.46 0.11 0.16 0.11 0.16 Fairfield Fairfield Reservoir/Wells < 0.1 < 0.1 0.11 < 0.1 < 0.1 < 0.1 Lake Park Silver Lake 0.28 0.30 0.22 0.3 0.3 < 0.1 Lenox Lenox East Reservoir/Twelve Mile Lake 0.27 0.34 0.36 0.68 < 0.1 0.10 Osceola West Lake 1.3 2.4 2.8 4.7 0.22 0.42 -
2.3(c)3 Biological Activated Carbon (BAC)
BAC is a process of removing soluble organic compounds in raw water through a combination of adsorption to GAC and biological oxidation by the microorganisms present in the activated carbon. The aerobic microbial growth in the activated carbon filters is enhanced by providing sufficient dissolved oxygen into the water ahead of the GAC beds. If organic compounds in the raw water are not readily biodegradable or recalcitrant substances are present, ozone is usually added ahead of the carbon filters. Consequently, pre-ozonation is sometimes used to convert larger, less biodegradable organic compounds into smaller, more easily metabolized molecules. As a result of biological oxidation, the activated carbon is not rapidly saturated with biorefractory compounds, and thus, the adsorption bed service life is extended. Generally all GAC columns are biofilters because GAC will remove the disinfectant in the top few inches of the bed. No studies or reports were found to provide information on the extent of removal of pesticides passing through BAC adsorption columns and no reference was found that distinguishes between adsorption and biodegradation.
-
-
2.3(d) Membrane Treatment
Membranes are used in water treatment for desalinization, specific ion removal, and removal of color, organics, nutrients, and suspended solids. Membranes are used in reverse osmosis (RO), electrodialysis (ED), ultrafiltration, microfiltration, and nanofiltration (JMM, 1985 and USEPA, 1989). Ultrafiltration is considered a filtering technique because it is designed to exclude compounds with molecular weights greater than 500 grams/mole. In contrast, RO and ED are designed to use a semipermeable membrane as a diffusion barrier for dissolved constituents in the water. ED is controlled by electrostatic attraction of ionic compounds to anionic and cationic electrodes across a semipermeable membrane. RO, however, is controlled by hydrostatic pressure (300 to 1000 psi) to drive feed water through a semipermeable membrane. Membranes are typically composed of cellulose acetate, polyamide membranes, and thin film composites. Membrane configurations for RO are spiral wound and hollow fine fiber membrane. The effectiveness of RO is dependent on membrane composition, physicochemical properties of raw water, pressure, and membrane treatment conditions. ED is affected by the amount of DC current.
-
2.3(d)1 Reverse Osmosis (RO)
The use of semipermeable membranes during RO treatment has been demonstrated to remove organic pollutants and pesticides from contaminated water. The membranes normally used in the past were either cellulose acetate (CA) or polyamide. Later, a new type of membrane called thin film composites was introduced. These membranes could be produced from a variety of polymeric materials that were formed in-situ or coated onto the surface of an extremely thin polysulfone support. Examples are NS-100 (cross-linked polyethylenimine membrane), FT-30 (cross-linked polyamide that contains carboxylate group), and DSI (modified polyalkene on a polysulfone base with non-woven polyester backing) (Lykins et al., 1988).
A short-term laboratory test conducted by Chian (1975) demonstrated that a NS-100 membrane was able to remove 97.8% of atrazine compared to 84.0% removal using a CA membrane. Since then, other studies by several investigators (Eisenberg and Middlebrooks, 1986; Baier et al., 1987; Miltner et al., 1989; Fronk et al., 1990), indicated, in general, thin film composite membranes have superior performance in removing pesticides compared to those of CA and polyamide membranes. For example, as summarized in Table 11, the percent removal of linuron from ground water samples was zero using CA, 57% using polyamide, and 99% using thin film composite DSI. Similar results were obtained for alachlor in surface water samples: 70% removal using CA, 77% using polyamide, and 100% by thin from composite FT -30. The high removal efficiencies for a wide range of initial concentrations [parts per billion (ppb) to parts per million (ppm)] are presented in Table 11. The reported data pertain to pesticides belonging to triazine, acetanilide, organochlorine, urea derivative, carbamate, and organophosphorus chemical classes. For individual compounds in each class and others [that include 1,2-dichloropropane, captan, trifluralin, and aldicarb transformation products (sulfoxide and sulfone)], the percent removal data in surface water (SW) and ground water (GW) are presented in Appendix A.
Table 11
Removal Efficiencies of RO Membranes for Different Pesticide ClassesPesticide Class Cellulose Acetate (CA) Polyamide Thin film Composite Triazine 23 - 59 68 - 85 80 - 100 Acetanilide 70 - 80 57 - 100 98.5 - 100 Organochlorine 99.9 - 100 100 Organophosphorus 97.8 - 99.9 98.5 - 100 Urea Derivative 0 57 - 100 99 - 100 Carbamate 85.7 79.6 - 93 > 92.9 Membranes that operate with a lower pressure can also be used in water treatment plants. Fronk et al. (1990) conducted an evaluation of the removal efficiency of certain pesticides from ground water using thin film composite membranes. The results are shown in Table 12. Complete removal (≈100%) of organochlorine pesticides (chlordane, heptachlor and methoxychlor) and an acetanilide compound (alachlor) was observed in this study. The removal of dibromochloropropane was not high and ethylene dibromide was not removed at all.
Table 12
Removal of Pesticides Using UltrafiltrationPesticide Class Pesticide Membrane C0 (µg/L) % Removal Organochlorine Chlordane Thin Film Composite < 100 (GW) ≈100 Heptachlor Thin Film Composite < 100 (GW) ≈100 Methoxychlor Thin Film Composite < 100 (GW) ≈100 VOC Dibromochloropropane Thin Film Composite < 100 (GW) 19-52 Ethylene dibromide Thin Film Composite < 100 (GW) ≈0 Others Alachlor Thin Film Composite < 100 (GW) ≈100 From Fronk et al., 1990
-
2.3(d)2 Nanofiltration (NF)
Nanofiltration (NF) is another filtration technique in which the membrane employed is somewhat looser and the process is operated with lower effective pressure and without significant changes in water salinity. A pilot-plant study reported by Hofman et al. (1997) indicated promising removal results, as summarized in Table 13. Using four different membranes, up to about 90% of diuron was removed, while maximum removal efficiencies of more than 90% were achieved for atrazine, simazine, and bentazon.
Table 13
Removal of Pesticides Using Nanofiltration MembranesPesticide Membrane C0 (µg/L) % Removal Atrazine (triazine) 4 different membranes not given 80-98 Simazine (triazine) 4 different membranes not given 63-93 Diuron (urea) 4 different membranes not given 43-87 Bentazon (miscellaneous) 4 different membranes not given 96-99 From Hofman et al, 1997
-
2.3(d)3 Integrated Membrane/Adsorbent Systems
Microfiltration (MF) with porosity nominally > 0.1 µm and ultrafiltration (UF) with porosity nominally 0.01 µm are sometimes combined with adsorbents such as PAC to form an integrated system that can be effective in removing pesticides. Anselme, et al. (1991) reported an integrated UF/PAC system that effectively removed some pesticides. Jack and Clark (1998) found that a UF/PAC (10 mg/L PAC) system was capable of removing 70% of cyanazine and 61 % of atrazine. With higher PAC levels, the removal of atrazine was increased from 57% at 5 mg/L to 89% at 20 mg/L PAC (Claire et al., 1997).
The integrated membrane/adsorbent system also is expected to lead to greater adsorption with an increase in the adsorbent contact time. Other factors that can influence the final degree of adsorption include temperature, pH (for ionizable pesticides), PAC type and dose, and competitive adsorption from dissolved natural organic materials and other contaminants.
-
-
2.3(e) Corrosion Control Treatments
Corrosion control is used in water treatment to limit the interaction of the treated water with pipes and water conduit systems. The principal processes for corrosion control are regulation of pH and addition of corrosion inhibitors (JMM, 1985 and USEPA, 1989). The adjustment of pH through the addition of lime or sodium hydroxide is required by EPA to inhibit metal dissolution (e.g., lead) in finished water. Chemical control agents, such as zinc orthophosphate, silicates, and polyphosphates, are added to encourage mineral coating (zinc carbonates or iron silicates) on the surface of the pipes, which prevents corrosion of pipes.
Control of pipe corrosion in potable distribution systems can be achieved by pH or alkalinity adjustment and application of corrosion inhibitors. So far, no studies have been found that would suggest that pesticides detected in raw or untreated water are removed or reduced during corrosion control operations in treatment plants. Whether calcium carbonate deposition or calcium reaction with phosphate inhibitors can ultimately lead to removal of pesticides in water remains to be seen. The pH adjustment, though, may have an impact on pesticides susceptible to pH dependent hydrolysis.
-
2.3(f) Aeration/Air Stripping
Aeration and air stripping are water treatment processes associated with gas transfer in drinking water. These processes have been used for the following purposes: inject disinfectants (O3 and ClO2) in finished water, inject O2 into feed water to accelerate oxidation, and remove ammonia (NH3) and volatile organic compounds (JMM, 1985 and USEPA, 1989). Gas exchange is accomplished using gas dispersion methods (e.g., bubbling air or mechanical mixing) or specially designed gas-liquid contact equipment (e.g., packed towers, cross-flow towers, and spray towers). Henry's Law Constant, the ratio of chemical concentrations in gas and liquid phases at equilibrium, has been used to predict the effectiveness of aeration and air stripping techniques on the removal of organic compounds.
The removal of volatile organic contaminants and pesticides can be accomplished by using packed towers, spray towers, or agitated diffused gas vessels. Qualitatively, the greater the Henry's Law Constant (H) of a chemical or pesticide, the more easily the chemical can be removed from the solution or aqueous phase by volatilization. Based on a study by McCarty (1987), a chemical with an H value of 1 x 10⁻³ atm m3 mole-1 or greater is susceptible to removal by aeration. Pesticides with H values slightly lower than 1 x 10⁻³ atm m3 mole-1 may still be removed, but more energy would be required. In addition, relatively higher towers and greater air/water ratios would be needed if a packed tower stripper is used. Examples of pesticides that are volatile organic compounds (VOCs) and that could be removed by air stripping include the following:
Examples of pesticides that are volatile organic compounds (VOCs) and that could be removed by air stripping Pesticide H (atm m3 mole-1) Dibromochloropropane 2.78 x 10⁻³ 1,2 - Dichloropropane 1.80 X 10⁻³ Ethylene dibromide 0.67 X 10⁻³
-
-
2.4 Pesticide Transformation Associated with Certain Treatment Processes
Most of the treatment processes that have been demonstrated to significantly remove pesticides from raw water involve physical phase separations in which the pesticides are transferred from the solution phase and then trapped or concentrated in a solid matrix, such as filters, activated carbon, or membranes. However, certain treatment operations ultimately lead to loss of the parent pesticides through chemical reactions. Thus, the pesticides are converted to another chemical(s) as transformation products. Transformations typically occur when a treatment chemical is introduced and subsequently significantly changes the acid-base character or facilitates the redox processes in the water. During lime softening and disinfection with chemical oxidants, some pesticides can be transformed into other process products. Some by-products resulting from ozonation of certain pesticides have been reported in a recent literature review on treatment of pesticide-contaminated raw water (Pisigan, 1998). These transformation products may be important to OPP.
Besides chemical transformations, pesticides are also susceptible to microbially-mediated oxidation in terrestrial and aquatic environments. This degradation pathway will ultimately lead to the formation of CO2 with the formation of intermediate by-products. In many cases these transformation products are identified in animal, plant, and soil metabolism studies that are required to be submitted by the registrant and reviewed by the Agency. Similar degradation pathways and transformation products are expected from chemical oxidation through the water treatment disinfection process. Data from the EPA-USGS pilot reservoir monitoring project indicate that water treatment processes have an impact on the recovery of organophosphates and some other pesticides in treated water when compared to spiked raw water samples (personal communication Joel Blomquist at USGS and James Carleton at EPA). In this study, low or non-existent analytical recoveries of some pesticides (especially organophosphates) occurred in spiked, treated water samples, presumably due to oxidation by residual chlorine. However, some oxidative transformation products (e.g., oxons, sulfoxides, sulfones, oxon-sulfones, etc.) of certain organophosphates (e.g., methyl parathion, ethyl parathion, fenamiphos, terbufos, azinphos-methyl, etc.) when spiked in treated water appear to have better analytical recoveries than their respective parent compounds. The recovery data suggest that organophosphates may be oxidized in treated water to form relatively stable, toxic transformation products.
-
2.4(a) Transformation Induced by Lime Softening
Basic chemicals such as slaked calcium oxide are added during lime softening to increase the pH of the water to about 10 - 11. Under alkaline conditions, pesticides that undergo alkaline hydrolysis are expected to transform. The extent of the alkaline hydrolysis and the formation of other products are affected by contact time and water quality characteristics.
Examples of pesticides that are known to be hydrolytically unstable at high pH values include demeton-S-methyl, carbofuran, captan, and methomyl. During high lime treatment for 2 hours, van Rensburg et al. (1978) observed that demeton-S-methyl was apparently hydrolyzed at pH 10.5, yielding about 70% removal of demeton-S-methyl present in the raw water at an initial concentration of 3100 µg/L. In conducting a study on the adsorption capacity of GAC for synthetic organics, Speth and Miltner (1998) reported that methomyl had to be tested with a pH of 2.8 to maintain stability because methomyl rapidly degraded over a wide pH range. This implies that at highly alkaline conditions methomyl may undergo very fast hydrolysis. According to fate properties summarized in Table 16, the alkaline (pH 9) hydrolysis half-lives of carbofuran and captan are 0.625 day and 0.00056 day, respectively. Carbofuran was found to be 100% removed during water softening at pH 10.9 and 11.1 in a full-scale treatment test conducted by Miltner et al. (1989). Based on Nanogen International (1975), the possible hydrolysis/hydroxylation products are 3-hydroxycarbofuran and carbofuran phenol. In the study conducted at EPA, carbofuran was shown to hydrolyze under alkaline conditions to form carbofuran-7-phenol as the major degradation product (USEPA, 1989). Thus, the possible softening reaction involving carbofuran may be represented as follows:
carbofuran →→→pH 10-11OH- →→→→ carbofuran-7-phenol + 3-hydroxycarbofuran
Other pesticides with short hydrolysis half-lives(< 1 day) at pH 9.0 are: desmedipham, dicofol, iprodione, thiodicarb, and 2-hydroxypropyl methanethiosulfonate. These pesticides potentially can be removed and transformed by basic hydrolysis during softening.
-
2.4(b) Transformation Caused by Chemical Disinfection/Oxidation
Chemical disinfection is widely used to destroy disease-causing microorganisms and thus make the treated water safe for human consumption. More than 95% of surface water treatment facilities, serving 501 to more than 100,000 persons, employ disinfection (USEPA, 1997a). For the same ranges of population served, at least 80% of the ground water treatment plants use disinfection to get rid of pathogens. The chemicals used as disinfectants include chlorine and chlorine compounds, ozone, iodine, and bromine. The most common form of disinfection practiced in the United States is the addition of chlorine to water. Ozone is a widely used disinfectant in Europe and is also becoming an alternative chemical oxidant and disinfectant in some water treatment facilities in the United States. Both chlorine and ozone are strong oxidizing agents that react with a variety of organic compounds and pesticides and convert the compounds to disinfection by-products that could be present in the treated water.
-
2.4(b)1 Chlorination By-products
Certain pesticides belonging to organophosphate and carbamate classes are susceptible to transformation during chlorination of raw water. Magara et al. (1994) has shown that organophosphate pesticides containing P=S bonds were easily degraded by chlorine and produced oxons (P=O bond) as a primary by-product. In a previous study (Aizawa and Magara, 1992), pesticides with a thiono group (-P=S-O-) such as diazinon, chlorpyrifos-methyl, fenthion (MPP), pyridaphenthion and those pesticides containing a dithio group (-P=S-S-) such as malathion, penthoate (PAP), and ethyl p-nitrophenyl benzenethionophosphate (EPN) were reported to yield oxons and other chlorination degradation products. In this study, diazinon was converted to diazoxon which may be further transformed to chlorinated products as shown below:
diazinon →Cl2→→→ diazoxon↓diethyl phosphoric acid↓dichloroacetic acidstrichloroacetic acids
However, diazoxon can remain stable for some time after it is formed. In an experiment in which chlorine was present at levels above 5 mg/L in an aqueous solution of diazinon (5 µg/L), diazoxon was observed to be highly stable against chlorine even after 48 hours (Magara, 1994).
Organophosphate pesticides may also be transformed to the oxon through biochemical reactions in mammalian tissues. Whether formed in mammalian tissues or introduced directly via drinking water, there is a concern with the formation of oxon forms of organophosphates, which are more potent acetylcholinesterase inhibitors than the parent form (Amdur et al., 1991). The oxon intermediate is readily hydrolyzed in mammalian systems.
In 2009, U.S.EPA evaluated the potential for ten organophosphate pesticides (phorate, disulfoton, terbufos, methidathion, bensulide, chlorethoxyfos, phosmet, methyl parathion, phostebupirim, and temephos) to undergo oxidation to their respective oxons and/or other oxidation analogues in laboratory water (Kamel et. al. 2009). Samples were collected at time intervals up to 72 hours of chlorination and analyzed by both gas chromatography-mass selective detection (GC-MSD) and liquid chromatography-tandem mass spectrometry (LC-MS/MS). The results, depicted in Table 14, show that methidathion and methyl parathion were stable in unchlorinated water, while all other OP pesticides were not stable over the 72-hour exposure period. In chlorinated water, phorate and disulfoton formed stable sulfone oxons. In the study, temephos formed stable dioxon sulfoxide and dioxon sulfone (Table 15). Methidathion, bensulide, chlorethyoxyfos, methyl parathion, and phostebupirim formed stable oxons over the 72-hour exposure period. Terbufos, phorate, disulfoton and temephos oxon sulfoxides; temephos sulfoxide; and phosmet oxon were initially formed but were not detected after 24 hours. The data illustrate that organothiophosphate pesticides may form oxons and/or other oxidation analogues during chlorination in water treatment plants, which are persistent for at least 72 hours.
Table 14
Organophosphate Degradation in Chlorinated and Unchlorinated Water (Kamel et. al. 2009)Parent Time (hr) Average Amount in chlorinated water (ng/mL) Average Amount in unchlorinated water (ng/mL) Spike Recovery (%) LC GC LC GC LC GC Bensulfide 0 15.0 ± 0 NA 18.0 NA 28.0 NA 1 2.0 ± 0 NA 21.0 NA 30.0 NA 4 2.5 ± 0.7 NA 16.0 NA 28.0 NA 24 ND NA 15.0 NA 30.0 NA 72 ND NA 17.0 NA NA NA Chlorethoxyfos 0 NA 42.0 ± 1.4 NA 41.0 NA 58.0 1 NA 12.0 ± 0 NA 42.0 NA NA 4 NA ND NA 32.0 NA 52.0 24 NA ND NA 3.0 NA NA 72 NA ND NA ND NA 102.0 Disulfoton 0 ND 64.0 ± 0 ND 64.0 20.0 72.0 1 ND ND ND 68.0 18.0 NA 4 ND ND ND 56.0 20.0 78.0 24 ND ND ND 24.0 22.0 NA 72 ND ND ND 16.0 NA 90.0 Methidathion 0 65.0 ± 2.1 85.0 ± 29.7 72.0 107.0 78.0 102.0 1 ND ND 73.0 110.0 88.0 NA 4 ND ND 73.0 109.0 90.0 94.0 24 ND ND 74.0 103.0 94.0 NA 72 ND ND 77.0 101.0 NA 118.0 Methyl parathion 0 NA 94.5 ± 0.7 NA 96.0 NA 94.0 1 NA 6.0 ± 6 NA 89.0 NA NA 4 NA ND NA 98.0 NA 92.0 24 NA ND NA 83.0 NA NA 72 NA ND NA 88.0 NA 106.0 Phorate 0 22.5 ± 0.7 61.5 ± 0.7 26.0 62.0 36.0 76.0 1 ND ND 24.0 68.0 38.0 NA 4 ND ND 20.0 52.0 36.0 50.0 24 ND ND 11.0 17.0 44.0 NA 72 ND ND 8.0 11.0 NA 90.0 Phosmet 0 ND 80.5 ± 0.7 ND 81.0 ND 40.0 1 ND ND ND 103.0 ND NA 4 ND ND ND 17.0 ND 4.0 24 ND ND ND ND ND NA 72 ND ND ND ND ND 98.0 Phostebupirim 0 19.0 ± 0 79.0 ± 0 23.0 78.0 36.0 82.0 1 2.5 ± 0.7 2.0 ± 0 22.0 71.0 34.0 NA 4 1.0 ± 0 ND 14.0 65.0 36.0 84.0 24 ND ND 8.0 30.0 36.0 NA 72 ND ND 10.0 14.0 NA 102.0 Temephos 0 54.5 ± 0.7 93.5 ± 0.7 67.0 94.0 20.0 100.0 1 3.0 ± 0 ND 46.0 121.0 18.0 NA 4 3.0 ± 0 ND 49.0 93.0 18.0 82.0 24 ND ND 40.0 43.0 20.0 NA 72 ND ND NA 11.0 NA 100.0 Terbufos 0 11.0 ± 0 63.0 ± 0 13.0 65.0 22.0 78.0 1 ND ND 12.0 64.0 22.0 NA 4 ND ND 8.0 46.0 22.0 68.0 24 ND ND 3.0 9.0 24.0 NA 72 ND ND 6.0 ND NA 49.0 Table 15
Measured Levels of Oxons in Chlorinated Water (Kamel et. al. 2009)Oxidation Products Time (h) Average amounts (± SD) in chlorinated water (ng/mL) Spike Recovery (%) LC GC LC GC Bensulide oxon 0 ND NA 86 NA 1 57.5 ± 0.7 NA 88 NA 4 54.5 ± 3.5 NA 92 NA 24 52 ± 4.2 NA 96 NA 72 58 ± 2.8 NA NA NA Chlorethoxyfos oxon 0 ND ND 80 78 1 16 ± 1.4 28 ± 2.8 76 NA 4 24 ± 1.4 48 ± 9.9 76 76 24 22 ± 2.8 28 ± 2.8 80 NA 72 15 ± 2.8 23 ± 0 NA 108 Disulfoton oxon 0 ND ND 98 80 1 ND ND 94 NA 4 ND ND 100 74 24 ND ND 102 NA 72 ND ND NA 96 Disulfoton oxon sulfoxide 0 ND ND NA NA 15 min 52.5 ± 2.1 7.5 ± 7.5 102 NA 4 ND ND 108 56 24 ND ND 98 50 72 ND ND 106 46 Disulfoton oxon sulfone 0 ND ND NA NA 15 min 22.5 ± 2.1 36 ± 0 130 NA 4 54 ± 0 33.5 ± 6.4 108 116 24 44 ± 4.2 21 ± 1.4 100 120 72 24.5 ± 2.1 15.5 ± 2.1 110 98 Methidathion oxon 0 ND 88 96 0 1 80.5 ± 0.7 94 ± 5.7 96 NA 4 84 ± 4.2 89 ± 11.3 100 94 24 78 ± 2.8 74.5 ± 3.5 102 NA 72 54 ± 5.7 66.5 ± 0.7 NA 118 Methyl paraoxon 0 ND ND 104 96 1 52 ± 8.5 79.5 ± 14.8 106 NA 4 75.5 ± 4.9 78.5 ± 9.2 110 94 24 76.5 ± 6.4 68 ± 2.8 116 NA 72 76.5 ± 2.1 67 ± 1.4 NA 118 Phorate oxon 0 ND ND NA 40 1 ND ND 86 NA 4 ND ND 90 64 24 ND ND 100 NA 72 ND ND NA 90 Phorate oxon sulfoxide 0 ND NA NA NA 15 min 77.5 ± 6.4 NA 98 NA 4 41 ± 8.5 NA 88 NA 24 ND NA 98 NA 72 ND NA 106 NA Phorate oxon sulfone 0 ND ND NA NA 15 min ND ND 100 NA 4 4.5 ± 0.7 4 ± 0 84 92 24 7 ± 1.4 2 ± 0 90 100 72 ND ND 94 84 Phosmet oxon 0 NA ND NA 40 1 NA 63 ± 8.5 NA NA 4 NA 8 ± 1.4 NA 4 24 NA ND NA NA 72 NA ND NA 86 Phostebupirim oxon 0 ND ND 96 88 1 50.4 ± 5.9 43.5 ± 0.7 96 NA 4 53 ± 2.8 46 ± 5.7 96 86 24 56.5 ± 3.5 43.5 ± 0.7 102 NA 72 54 ± 2.8 48.5 ± 2.1 NA 104 Temephos sulfoxide 0 ND NA NA NA 15 min 3.4 ± 0.7 NA NA NA 4 ND NA NA NA 24 ND NA NA NA 72 ND NA NA NA Terbufos oxon 0 ND ND 66 76 1 ND ND 60 NA 4 ND ND 64 62 24 ND ND 78 NA 72 ND ND NA 92 Terbufos oxon sulfoxide 0 ND NA NA NA 15 min ND NA 104 NA 4 ND NA 98 NA 24 ND NA 100 NA 72 ND NA 102 NA Terbufos oxon sulfone 0 ND ND NA NA 15 min 33 ± 2.8 ND 110 NA 4 4.5 ± 0.7 ND 108 104 24 ND ND 96 118 72 ND ND 106 84 Certain carbamate pesticides may also react with chlorine to produce disinfection by-products. In a chlorination study conducted by Mason et al. (1990), both aldicarb and methomyl were shown to be transformed by an electrophilic ionic attack by hypochlorous acid (HOCl), which is formed by chlorine hydrolysis in water. The reaction between methomyl and HOCl was found to be several orders of magnitude faster than the reaction between aldicarb and HOCl. Sodium chloride concentration (reflecting ionic strength) and pH were shown to affect the chlorination rates. The chlorination of aldicarb may be described by the following reaction:
aldicarb →→HOCl→→ (aldicarb sulfoxide + aldicarb sulfone + adicarb oxime + aldicarb-sulfoxide oxime + aldicarb nitrile + sulfur-containing alcohol)
No product analysis was conducted for the methomyl-HOCl reaction. The result of a preliminary bioassay using Daphnia magna to compare the toxicity of aldicarb and chlorination by-products indicated that the by-products were less toxic to this invertebrate.
A thiocarbamate, thiobencarb, has been reported to be transformed by chlorination during water purification (Magara et al., 1994). The chlorine reaction with the pesticide present in raw water can be described as follows:
thiobencarb →→→→ chlorobenzyl alcohol + chlorotoluene + chlorobenzoic acids + chlorobenzyl chloride + chlorobenzyl aldehyde
It was further reported that when thiobencarb was detected in raw water, chlorobenzyl chloride (up to 12 µg/L), chlorobenzoic acid, and chlorobenzyl aldehyde were detected in the filter water of a Japanese purification plant.
-
2.4(b)2 Ozonation By-products
Ozone is a powerful oxidizing agent that can react in water directly with dissolved organic compounds or can generate radical species such as a hydroxyl radical (OH-), which is much more reactive than ozone. Experiments were conducted by Adams and Randtke (1992) on the ozonation of atrazine in natural and synthetic waters with a maximum initial concentration of 15 µg/L. Two conditions were used in these experiments:
-
low pH and high alkalinity, which inhibited the auto-decomposition of ozone to the hydroxyl radical; and
-
high pH and low alkalinity, which favored the production of hydroxyl radical from ozone.
The natural waters were obtained from Clinton Reservoir, Perry Reservoir, Kansas River and Missouri River. The investigators proposed the following major degradation pathway for the ozonation of atrazine in water treatment processes:
atrazine → deethylatrazine + deisopropylatrazine + deisopropylatrazine amide + 2-chloro-4,6- diamino-s-triazine
The other minor pathway described yielded by-products such as hydroxyatrazine, 2-amino-4-ethylamino-6-hydroxy-s-triazine, and 2-amino-4-hydroxy-6-ethylamino-s-triazine.
The kinetic formation trends of the products were observed to change as pH increased from 5 to 7, and then to 9. Other additional products formed by atrazine reaction with ozone with or without hydrogen peroxide were recently reported by other investigators (Acero et al., 2000; Nelieu et al., 2000).
Because of the growing interest in removal and transformation of pollutants during ozonation, attempts have been made to evaluate the reactivity of pesticides with ozone in water. Hu et al. (2000) determined the rate constant of ozone with four groups of pesticides (4 phenolic-, 8 organonitrogen-, 8 phenoxyalkylacetic acid-, and 4 heterocyclic - pesticides) under controlled conditions simulating natural waters. The results of this correlation analysis indicated that the reactivity of pesticides can be estimated using the energy of the highest occupied molecular orbital of the chemicals (εHOMO). A pesticide with a high εHOMO can be expected to yield a high rate constant of ozonation.
Information on the chemical identities and concentrations of transformation products resulting from chemical disinfection is important in drinking water exposure assessments. Rules pertaining to allowable levels of disinfection by-products have been addressed already in Europe and the United States. The EU promulgated a new regulation that establishes not only maximum concentrations of pesticides in drinking water but also includes their degradation products after water treatment (Acero et al., 2000). In the United States, MCLGs and MCLs also have been developed by USEPA for several by-products (trihalomethanes, haloacetonitriles, haloketones, haloacetic acids, etc.) generated from chlorination of dissolved organic compounds in raw water under the Disinfectants/Disinfection By-Products Rule of 1998.
-
-
-
-
2.5 Literature Review Conclusions
Based on a review of available literature, OPP concludes that, in general, conventional water treatment processes at most CWSs, specifically coagulation-flocculation, sedimentation, and conventional filtration, do not remove and transform pesticides in finished drinking water. Disinfection and water softening, which also routinely occur at CWSs can, however, may lead to pesticide transformation and, in some cases, pesticide removal or degradation. This finding is important because disinfection and conventional coagulation/filtration are commonly used treatment processes at CWSs in the United States. Chemical disinfection has been shown to form pesticide degradation products, which may or may not correspond to degradation products currently considered in OPP risk assessments (i.e., if the pesticide degradation by-products are not observed in standard metabolism studies and other studies required by OPP, there may be limited information on the nature and toxicological importance of the pesticide to warrant consideration). The type of disinfectant used and the length of contact time with the disinfectant are important factors in assessing water treatment effects.
PAC filtration, GAC filtration, and RO have been demonstrated to be highly effective processes for removing organic chemicals, including certain pesticides (primarily acetanilide herbicides), but specific data on removal of most pesticides are not available. Also, air stripping is only effective for volatile pesticides and those with a high Henry's Law Constant. Among these organic removal treatment processes, PAC is the more common method because it can be used in concert with conventional water treatment systems with no significant additional capital investment. Available data suggest that about 46% of large CWSs (e.g., those serving > 100,000 people) use PAC at some time during the year, and that most of these systems are surface water-based systems (SAIC, 1999). Air stripping is an effective water treatment for volatile pesticides (Henry's Law Constants > 1 x 10⁻³ atm m3/mole), but this method is used at very few CWSs (less than 1% of CWSs).
-
2.6 SAP Comments On Literature Review
The report of the SAP committee on the preceding literature review was issued on February 12, 2001 and can be found at the following web site: FIFRA Scientific Advisory Panel Historical Meetings. In general, the SAP members concurred with the technical conclusions of OPP's background document and agreed that conventional treatment (coagulation/flocculation, sedimentation and filtration) is generally not effective in removing residues of mobile (hydrophilic/lipophobic) pesticides from raw surface or ground water.
The following is a summary of the SAP comments:
-
Hydrophobic or lipophilic pesticides may be removed through conventional water treatment processes such as coagulation/flocculation, sedimentation, and filtration.
-
Predicting the impact of a water treatment process on pesticide removal and transformation is hampered by variability of water treatment processes employed among public water systems and the variability in source water quality.
-
Bench-scale or "jar" tests can be used to assess the impacts of water treatment processes (e.g., coagulation, flocculation and sedimentation, and adsorption on PAC). Because jar tests are expected to yield higher removal efficiencies than actual water treatment plants, pilot- and full-scale water treatment plant studies are needed to validate water treatment effects.
-
Pesticides that exhibit alkaline hydrolysis may be degraded through high pH water softening processes.
-
The impact of disinfection on pesticide transformation should be considered in the drinking water assessments. An evaluation of probable disinfection by-products should be evaluated in this assessment process.
-
The Agency should assume that finished water pesticide concentrations are the same as the raw water pesticide concentrations until adequate research is conducted on water treatment effects on pesticide removal and transformation. Exceptions to this approach may occur when chlorination or hydrolysis causes chemical transformation of the pesticide. It is important to consider the health effects of the transformation products.
-
Monitoring finished drinking water levels for pesticides found in raw water should be among EPA's highest priorities to assess water treatment effects on pesticide removal and transformation.
-
-
2.7 Assessment of the Relationship Between Environmental Fate Properties and Water Treatment Effects
In order to assess the environmental behavior of a pesticide, OPP requires the registrant to submit environmental fate and transport data and physicochemical properties for each pesticide and its toxicologically significant degradation products under specific use conditions and use patterns. The core environmental fate data for most pesticide registrations include laboratory studies and physical/chemical properties of the pesticide. Laboratory studies include abiotic hydrolysis, photodegradation in water and soil, aerobic and anaerobic metabolism in water and soil, batch equilibrium/soil column leaching, and volatility from soil. Physical/chemical properties of the pesticide include the chemical structure, molecular weight, solubility, vapor pressure, Henry's Law Constant, octanol-water partitioning coefficient, and dissociation constants. These data are used in environmental fate models for estimating pesticide concentrations in aquatic environments and drinking water. The range of pesticide properties evaluated in referenced water treatment studies is shown in Table 16.
As part of this project, a regresssion analysis was conducted to assess possible relationships between pesticide fate properties and removal efficiencies for GAC, PAC, and RO. Based on reviewed data, there were no quantitative relationships or trends observed between pesticide properties (Kow and molecular weight) and removal efficiencies. The analysis is limited by the small range of values, which limits defining trends or relationships. However, Speth and Miltner, 1998 reported that, in general, compounds with Freundlich coefficients on activated carbon greater than 200 µg/g (L/µg)1/n are susceptible to removal by carbon sorption. Additional data are needed to assess trends and develop regression models for predicting pesticide removal from environmental fate and physicochemical data.
Qualitative water treatment effects, however, may be predicted using environmental fate data. For example, alkaline catalyzed hydrolysis is expected to occur through water softening because of the pH alteration required for CaCO3 and Mg(OH)2 precipitation. This effect has been observed for carbofuran because it hydrolyzes rapidly at pH 9 (Table 16). Also, pesticide removal through adsorption on activated carbon can be predicted using physical/chemical properties. Compounds exhibiting high Koc, low solubility, and high octanol-water partitioning coefficients are expected to exhibit high binding affinities for activated carbon (Speth and Adams, 1993). Further ability of the pesticide to oxidize may be inferred from aerobic soil metabolism data. Compounds with short aerobic soil metabolism half-lives are expected to be more prone to chemical oxidation. Finally, functional group analysis as indicated by acid or base dissociation constants provides some basic information on speciation of the pesticide and its possible adsorption potential (cation or anion exchange) on surfaces of colloids, flocs, and activated carbon. Further research is needed in assessing the quantitative relationship between pesticide fate properties and removal efficiencies.
-
-
Considering Water Treatment in FQPA Drinking Water Assessments
An approach for considering drinking water treatment effects on pesticide removal and transformation in FQPA risk assessments is outlined below. Because most surface source drinking water receives some form of water treatment prior to human consumption, this guidance is generally applicable to surface source drinking water. A similar assumption cannot be made for drinking water systems using ground water because private wells are not generally linked to water treatment systems prior to human consumption. This procedure is based on scientific conclusions reached as a result of OPP's literature review and on OPP's assessment of the availability of information on water treatment effects for specific effects:
-
3.1 Procedure for Considering Water Treatment in FQPA Drinking Water Assessments
-
OPP's EFED will provide available information on the potential and measured effects from drinking water treatment (e.g., flocculation, coagulation, sedimentation, filtration, chlorination, softening, and GAC/PAC treatment) to the HED ROCKS. The ROCKS will evaluate this information and determine which, if any, transformation and degradation products should be of toxicological concern. This information will also be considered in FQPA Safety Factor decisions.
-
OPP will not conclude that treatment mitigates exposure for a specific pesticide without supporting evidence. Therefore, if sufficient pesticide-specific information is not available on effects of a water treatment process or if sufficient information is not available on the extent to which specific processes are employed within the pesticide use area, FQPA drinking water assessments will be conducted using pesticide concentrations in raw or ambient waters to represent pesticide concentrations in finished drinking water. This guidance is based on the fact that conventional water treatment processes (coagulation/flocculation, sedimentation, and filtration) are not expected to remove mobile pesticides during treatment.
-
If sufficient pesticide-specific information is available on effects of a water treatment process, as well as information on the extent to which such a process is employed within the pesticide use area, EFED will describe quantitatively the potential effects of drinking water treatment for that pesticide in the drinking water assessment. This description will include effects of degradation and formation of transformation products.
-
Monitoring data on finished drinking water may also represent in aggregate the effects of treatment in the study area. However, because of the inherent variability associated with water treatment processes, with source water quality, and the limited availability of monitoring data on pesticides in finished drinking water, extrapolating such results to areas outside of the area monitored will be considered on a case-by-case basis only. It is anticipated that quantification of drinking water treatment effects will be limited to pesticides with extensive monitoring data on finished water (e.g., atrazine) or pesticides with monitoring data on finished water from focused or limited use areas (e.g., molinate). Extrapolating treatment effects across compounds with similar structures will also be considered on a case-by-case basis.
-
-
3.2 Evaluation of Water Treatment Data Provided to the Agency
OPP will evaluate water treatment data submitted to the Agency in support of pesticide registration and re-evaluation activities. Water treatment data can be derived from studies providing information on the removal/transformation efficiency of the pesticide and identification of transformation by-products. Because there are no standard guideline water treatment studies, water treatment data can be derived from a simple laboratory study (commonly referred to as "jar test") and actual water treatment plant monitoring studies. (Section 2.2 provides more detailed information on water treatment assessment techniques.)
Supporting water treatment data will be considered in drinking water assessments when sufficient and representative pesticide-specific water treatment data are available. OPP will consider the quality of water treatment data on a case-by-case basis.
Criteria for evaluation of water treatment data are expected to be variable because of the various types of water treatment data as well as the variability of treatment across a pesticide use area. Based on recommendations from the FIFRA SAP, general evaluation criteria of water treatment data include the following:
-
Laboratory-scale treatment studies such as jar tests will be used only to confirm when treatment has no effect on pesticide removal and transformation. This assessment approach was recommended by the SAP because jar tests are known to exaggerate the removal efficiency when compared to actual treatment plants.
-
When jar tests show pesticide specific removal or transformation, OPP will request that the registrant conduct pilot-plant or actual water treatment plant monitoring studies in order to establish realistic removal or transformation efficiencies for consideration in refining drinking water assessments. These studies should represent the treatment systems and processes found in the pesticide use area. Submission of water treatment and water quality data in the pesticide use area are needed to ensure the representative nature (bracketing conditions in the pesticide use area) of the water treatment data. Monitoring data should also provide temporally-paired raw water and finished water samples, and paired samples may be required for individual treatment processes if interactive effects are expected from sequential treatment processes.
Table 16
Physical/Chemical and Environmental Fate Properties of Pesticides 1Pesticide MW pKa or pKb log Kow Koc Henry's Law Constant
(atm-m3/mol)Vapor Pressure
(torr)Solubility
(ppm)pH 7 hydrolysis half-life
(day)pH 9 hydrolysis half-life
(day)Aqueous Photolysis half-life
(day)Aerobic Soil Metabolism half-life: typical and (range)
(day)2,4,5-T 255.48 2.84 a 3 238 alachlor 269.77 2.64 190 3.20E-08 2.2 E-05 242 stable stable 80 17.5 (14-21) aldicarb 190.26 0.7 30 1.0 E-04 6000 stable 16.7 (1-56) aldrin 364.91 3.01 7.5 E-05 0.027 atrazine 215.69 12.3 2.68 88 2.58E-09 3.0 E-07 33 stable stable stable 83.5 (21-146) bentazon 240.3 21 6.30E-12 1.0 E-09 500 stable stable < 1 38.6 (14-65) captan 300.59 8.0 E-08 33 0.25 0.005556 stable 4 (1-7) carbofuran 221.6 1.98 29 5.2 E-07 700 7.28 0.625 stable 130 (21-350) chlordane 409.78 3.32 1.4E5 9.60E-06 1.0 E-05 600 cyanazine 240.7 12.9 56 3.17E-12 1.00E-08 171 stable stable 43 28.5 (10-70) DBCP 236.36 2.78E-03 10 1000 180 diazinon 304.34 3.01 530 1.40E-06 1.4 E-04 40 stable stable 34 18 (4-28) dichloropropene 110.97 36 1.80E-03 27.3 2500 13.5 13.5 33 (12-54) dieldrin 380.91 8.08E-03 3.1 E-06 0.25 diuron 233.1 2.81 480 2.26E-08 8.6 E-09 42 stable stable 43 98 (30-144) endrin 380.91 4.00E-07 2.0 E-07 ethylene dibromide 187.85 1.76 22.5 6.73E-04 11.7 4300 heptachlor 373.32 4.41 4.00E-03 3.0 E-04 0.06 64 (37-112) heptachlor epoxide 389.3 2.7 220 4.00E-04 3.0 E-04 0.35 lindane 290.83 1263 3.60E-07 9.4 E-06 10 stable 36 stable 523 (66-980) linuron 249.1 2.19 863 6.56E-08 1.1 E-05 75 stable stable 49-76 87.5 (84-91) methoxychlor 345.65 3.62 8E5 0.1 stable stable stable 120 metolachlor 283.8 229 9.16E-09 1.3 E-05 530 stable stable 70 67 metribuzin 214.29 13 1.6 19 3.50E-11 1.2 E-07 1100 stable stable 0.179167 73 (40-106) parathion 291.26 1.8E4 3.8 E-05 24 108 95 (50-140) pendimethalin 281.31 3.6E4 2.22E-05 2.9 E-06 0.38 stable stable 17-21 1322 simazine 201.66 12.35 2.51 124 3.20E-10 6.1 E-09 3.5 stable stable stable 36 toxaphene 413.81 1E5 0.17 0.037 9 trifluran 335.28 5.07 8000 1.62E-04 1.1 E-04 0.3 stable stable 0.37 115 1 Data were derived from the EFED One-Liner Data Base.
MW = Molecular Weight
pKa = negative log of acid dissociation constant
pKb = negative log of base dissociation constant
Kow = octanol/water partition constant
Koc = organic carbon sorption coefficient -
-
-
Literature Cited
-
Acero, J.L., K. Stemmler, and U. Von Guten. 2000. Degradation Kinetics of Atrazine and Its Degradation Products with Ozone and OH Radicals: A Predictive Tool for Drinking Water Treatment. Environ. Sci. Technol. 34: 591-597.
-
Adams, C.D. and S.J. Randtke. 1992. Removal of Atrazine from Drinking Water by Ozonation. Jour. AWWA. 84(9): 91-102.
-
Aizawa, T. and Y. Magara. 1992. Behavior of pesticides in drinking water purification system. Water Malaysia '92. Cited by Magara et al. 1994. Degradation of Pesticides by Chlorination during Water Purification. Wat. Sci. Tech. 30(7): 119-128.
-
Amdur, PhD, J. Doull, PhD, C.D. Klaassen, PhD, 1991. Casarett and Doull's Toxicology: The Basic Science of Poisons, 4th Edition, Editors: M.O., pub. McGraw Hill, Inc.)
-
Anselme, C., J.L. Bersillion, J. and J. Mallevialle. 1991. The Use of Powdered Activated Carbon for the Removal of Specific Pollutants in Ultrafiltration Processes. In Proceedings, AWAA Membrane Processes Conference, March 10-13, 1991. Orlando, FL.
-
Baier, J.H., B.W. Lykins, Jr., C.A. Fronk and S.J. Kramer. 1987. Using Reverse Osmosis to Remove Agricultural Chemicals from Groundwater. Jour. AWWA. 79: 55-60.
-
Chian, E. 1975. Removal of Pesticides by Reverse Osmosis. Environ. Sci. Technol. 9(10) (Jan. 1975).
-
Claire, D., S. Randtke, P. Adams, and S. Shreve. 1997. Microfiltration of a High-Turbidity Surface Water with Post-Treatment by Nanofiltration and Reverse Osmosis. In Proceedings, AWWA Membrane Technology Conference. February 23-26, 1997, New Orleans, LA.
-
Code of Federal Register. 1991. Part II Environmental Protection Agency 40 CFR Parts 141, 142, and 143, National Primary Drinking Water Regulations; Final Rule. Vol. 56. No. 20.
-
Eisenberg, T.N. and Middlebrooks, E.J. 1986. Reverse Osmosis Treatment of Drinking Water. Butterworth Publishers, London.
-
Faust, S.D. and O.M. Aly. 1999. Chemistry of Water Treatment. 2nd Ed. Lewis Publishers. Boca Raton, FL.
-
Fronk, C.A. and D. Baker. 1990. Pesticide Removal by Membrane Processes. Paper presented at the 1990 Annual Conference of AWWA. Cincinnati, OH. (June 17-21, 1990).
-
Fronk, C.A., B.W. Lykins, Jr., and J.K. Carswell. 1990. Membranes for Removing Organics from Drinking Water. Proc. 1990 Amer. Filtration Soc. Annual Meeting, Washington, DC (March 18-22, 1990)
-
Hofman, J.AM.H., E.F. Beerendonk:, H.C. Folmer, J.C. Kruithof. 1997. Removal of Pesticides and Other Micropollutants with Cellulose-acetate, Polyamide and Ultra-low Pressure reverse Osmosis Membranes. Desalination 113:209-214.
-
Hu, J., T. Morita, Y. Magara, and T. Aizawa. 2000. Evaluation of Reactivity with Ozone Using the Energies of Frontier Molecular Orbitals. Wat. Res. 34(8): 2215-2222.
-
Jack AM., and M.M. Clark. 1998. Using PAC-UF to Treat a Low-Quality Surface Water. J. AWWA, 90(11): 83-95.
-
JMM, 1985. James M. Montgomery Consulting Engineers, Inc., Water Treatment: Design and Design. John Wiley & Sons, New York.
-
Kamel, A Byrne, C. Vigo, C. Ferrario, J. Staffor, C. Verdin, G. Siegelman, F. Knizner, S. Hetrick, J. 2009. Oxidation of selected organophosphate pesticides during chlorination of simulated drinking water. Water Research 43:522-534
-
Lykins, B., R Clark, C. Fronk. 1988. Reverse Osmosis for Removing Synthetic Organics from Drinking Water: A Cost and Performance Evaluation. Paper presented at the 1988 Annual Conference of AWWA. Orlando, FL. (June 19-23, 1988).
-
Lytle, Darren A. 1995. How Do I Run A Proper Jar Test Procedures? 1995 AWWA Water Quality and Technology Conference. New Orleans, LA
-
Magara, Y., T. Aizawa, N. Matumoto, and F. Souna 1994. Degradation of pesticides by chlorination during water purification. Groundwater Contamination, Environmental Restoration, and diffuse Source Pollution. Water Science and Technology. 30(7): 119-128.
-
Mason, Y., E. Choshen, and C. Rav-Acha. 1990. Carbamate Insecticides Removal from Water by Chlorination and Ozonation. Wat. Res. 24(1): 11-21.
-
McCarty, Perry L. 1987. Chapter 4: Removal of Organic Substances from Water by Air Stripping. In Control of Organic Substances in Water and Wastewater. Bernard B. Berger (editor). Noyes Data Corporation, Park Ridge, NJ.
-
Miller III, J.G. and Kennedy, J.K. 1995. Study of Herbicides in water and Sediment from 19 Iowa Water Supply Reservoirs, January-February, 1995. University Hygienic Laboratory (Limnology Section), University of Iowa, Iowa City, IA Report No. 95-1, 89 pp.
-
Miltner, R.J., C.A Fronk, and T.F. Speth. 1987. Removal of Alachlor from Drinking Water. Proc. Nat'l Conference on Environ. Engineering, ASCE. Orlando, FL (July 1987).
-
Miltner, R.J., D.B. Baker, T.F. Speth, and C.A. Fronk. 1989. Treatment of Seasonal Pesticides in Surface Waters. Jour. AWWA 81: 43-52.
-
Najm, I.N., V.L. Snoeyink, B.W. Lykins, Jr., and J.Q. Adams. 1991. Using Powdered Activated Carbon: A Critical Review. Jour. AWWA. 83(1): 65-76.
-
Nanogen International (1975) as cited by Miltner, R.J., D.B. Baker, T.F. Speth, and C.A. Fronk. 1989. Treatment of Seasonal Pesticides in Surface Waters. Jour. AWWA. 81: 43-52.
-
Nelieu, S., L. Kerhoas, and J. Einhorn. 2000. Degradation of Atrazine into Ammeline by Combined Ozone/Hydrogen Peroxide Treatment in Water. Environ. Sci. Technol. 34: 430-437.
-
Pisigan, Jr., R.A. 1998. Treatment of Pesticide Contaminated Raw Water: Importance to Drinking Water Exposure Assessment. Paper Presented at the 19th Annual Meeting of SETAC. Charlotte, NC (November 15-19, 1998).
-
SAIC, 1999. Science Applications International Corporation. Geometries and Characteristics of Public Water System. Draft Report prepared for United States Environmental Protection Agency in Washington, D.C., McLean, VA 22102.
-
Speth, T.F. 1993. "Glyphosate Removal from Drinking Water", J. Environ. Eng. Div. ASCE, 119, 6, 1139-1157.
-
Speth, T.F. and J.Q. Adams. 1993. "GAC and Air Stripping Design Support for the Safe Drinking Water Act", Strategies and Technologies for Meeting SDWA Requirements. Clark, R. and S. Summers, Eds., Lewis Publishers, Ann Arbor, MI, pp. 47-89.
-
Speth, T.F. and R.J. Miltner. 1998. Technical note: adsorption capacity of GAC for synthetic organics. Jour. AWWA. 90(4): 171-174.
-
United States Environmental Protection Agency (USEPA). 1989. Technologies for Upgrading Existing or Designing New Drinking Water Treatment Facilities. EPA/625/4-89/023.
-
USEPA. 1997a. Community Water System Survey Volume I: Overview. EPA 815-R-97-001a.
-
USEPA. 1997b. Community Water System Survey Volume II: Detailed Survey Result Tables and Methodology Report. EPA 815-R-97-001b.
-
USEPA. 1998. Small System Compliance Technology List for the Non-Microbial Contaminants Regulated Before 1996. EPA 815-R-98-002.
-
van Rensburg, J.F.J, P.G. van Rossum, and W.H.J. Hattingh. 1978. The Occurrence and Fate of Organic Micro-Pollutants in a Water Reclaimed for Potable Reuse. Prog. Wat. Tech. 10(1&2): 41-48.
-

Appendix A
Removal of Pesticides Using Different Reverse Osmosis Membranes
Class
| Pesticide | Membrane | C0 (µg/L) | % Removal | Reference |
|---|---|---|---|---|
| Atrazine | Cellulose Acetate | 86.5 -161.3 (GW) 2.46 - 11.75 (SW) |
38.5 29 |
Fronk & Baker (1990) Fronk & Baker (1990) |
| Polyamide | 86.5 - 161.3 (GW) 2.46 - 11.75 (SW) |
68 78 |
Fronk & Baker (1990) Fronk & Baker (1990) |
|
| Thin Film Composite (FT-30) | 2.46 - 11.75 (SW) | 100 | Fronk & Baker (1990) | |
| Thin Film Composite (DSI) | 86.5 - 161.3 (GW) | 80-100 | Fronk & Baker (1990) | |
| CA | 1101.7 | 97.82 | Eisenberg & Middlebrooks (1986) | |
| NS-100 | 1101.7 | 84.02 | Eisenberg & Middlebrooks (1986) | |
| Cyanazine | Cellulose Acetate | 0.0 - 2.53 (SW) | 40-50 | Fronk & Baker (1990) |
| Polyamide | 0.0 - 2.53 (SW) | 69 | Fronk & Baker (1990) | |
| Thin Film Composite (FT-30) | 0.0 - 2.53 (SW) | 100 | Fronk & Baker (1990) | |
| Metribuzin | Cellulose Acetate | 0.0 - 2.53 (SW) | 59 | Fronk & Baker (1990) |
| Polyamide | 0.0 - 2.53 (SW) | 76 | Fronk & Baker (1990) | |
| Thin Film Composite (FT-30) | 0.0 - 2.53 (SW) | 100 | Fronk & Baker (1990) | |
| Simazine | Cellulose Acetate | 86.1 -117.2 (GW) 0.11 - 0.82 (SW) |
31 23 |
Fronk & Baker (1990) Fronk & Baker (1990) |
| Polyamide | 86.1 - 117.2 (GW) 0.11 - 0.82 (SW) |
85 72 |
Fronk & Baker (1990) Fronk & Baker (1990) |
|
| Thin Film Composite (FT-30) | 0.11 - 0.82 (SW) | 100 | Fronk & Baker (1990) | |
| Thin Film Composite (DSI) | 86.1 - 117.2 (GW) | 99 | Fronk & Baker (1990) |
| Pesticide | Membrane | C0 (µg/L) | % Removal | Reference |
|---|---|---|---|---|
| Alachlor | Cellulose Acetate | 0.78 - 6.44 (SW) | 70 | Fronk & Baker (1990) |
| Polyamide | 0.78 - 6.44 (SW) | 77 | Fronk & Baker (1990) | |
| Thin Film Composite (FT-30) | 73.4 - 106 (GW) 0.78 - 6.44 (SW) |
100 100 |
Fronk & Baker (1990) Fronk & Baker (1990) |
|
| Cellulose Acetate | 1.65 (SW) | 71.4 | Miltner et al. (1989) | |
| Nylon Amide | 1.65 (SW) | 84.6 | Miltner et al. (1989) | |
| Thin Film Composite | 1.65 (SW) | 98.5 | Miltner et al. (1989) | |
| Metolachlor | Cellulose Acetate | 2.73 - 14.61 (SW) | 80 | Fronk & Baker (1990) |
| Polyamide | 2.73 - 14.61 (SW) | 78 | Fronk & Baker (1990) | |
| Thin Film Composite (FT-30) | 30.9 - 111 (GW) 2.73 - 14.61 (SW) |
100 100 |
Fronk & Baker (1990) Frank & Baker (1990) |
| Pesticide | Membrane | C0 (µg/L) | % Removal | Reference |
|---|---|---|---|---|
| Linuron | Cellulose Acetate | 74.7 - 106.8 (GW) 0.0 - 1.18 (SW) |
0 0 |
Fronk & Baker (1990) Fronk & Baker (1990) |
| Polyamide | 74.7 - 106.8 (GW) 0.0 - 1.18 (SW) |
57 100 |
Fronk & Baker (1990) Fronk & Baker (1990) |
|
| Thin Film Composite (FT-30) | 0.0 - 1.18 (SW) | 100 | Fronk & Baker (1990) | |
| Thin Film Composite (DSI) | 74.7 - 106.8 (GW) | 99 | Fronk & Baker (1990) |
| Pesticide | Membrane | C0 (µg/L) | % Removal | Reference |
|---|---|---|---|---|
| Aldrin | CA | 142.3 | 100 | Eisenberg & Middlebrooks (1986) |
| NS-100 | 142.3 | 100 | Eisenberg & Middlebrooks (1986) | |
| Heptachlor | CA | 505.4 | 100 | Eisenberg & Middlebrooks (1986) |
| NS-100 | 505.4 | 100 | Eisenberg & Middlebrooks (1986) | |
| Dieldrin | CA | 321.3 | 99.88 | Eisenberg & Middlebrooks (1986) |
| NS-100 | 321.3 | 100 | Eisenberg & Middlebrooks (1986) |
| Pesticide | Membrane | C0 (µg/L) | % Removal | Reference |
|---|---|---|---|---|
| Diazinon | CA | 437.7 | 98.25 | Eisenberg & Middlebrooks (1986) |
| NS-100 | 437.7 | 98.05 | Eisenberg & Middlebrooks (1986) | |
| Malathion | CA | 1057.8 | 99.16 | Eisenberg & Middlebrooks (1986) |
| NS-100 | 1057.8 | 99.66 | Eisenberg & Middlebrooks (1986) | |
| Parathion | CA | 747.3 | 99.88 | Eisenberg & Middlebrooks (1986) |
| NS-100 | 747.3 | 99.83 | Eisenberg & Middlebrooks (1986) |
| Pesticide | Membrane | C0 (µg/L) | % Removal | Reference |
|---|---|---|---|---|
| Captan | CA | 668.9 | 97.78 | Eisenberg & Middlebrooks (1986) |
| NS-100 | 668.9 | 100 | Eisenberg & Middlebrooks (1986) | |
| Trifluralin | CA | 1578.9 | 99.74 | Eisenberg & Middlebrooks (1986) |
| NS-100 | 1578.9 | 99.99 | Eisenberg & Middlebrooks (1986) | |
| Carbofuran | Cellulose Acetate | 14 (GW) | 85.7 | Lykins et al. (1988); Fronk et al. (1990) |
| Polyamide | 14 (GW) | > 92.9 | Lykins et al. (1988); Fronk et al. (1990) | |
| Thin Film Composite* | 14 (GW) | > 92.9 | Lykins et al. (1988); Fronk et al. (1990) | |
| Polyamide** | 4.3 - 9.8 (GW) | 79.6 - 90.0 | Lykins et al. (1988); Fronk et al. (1990) | |
| 1,2-Dichloropropane | Cellulose Acetate | 24 (GW) | 4.2 | Lykins et al. (1988); Fronk et al. (1990) |
| Polyamide | 24 (GW) | 75 | Lykins et al. (1988); Fronk et al. (1990) | |
| Thin Film Composite* | 24 (GW) | 37.5 - 87.5 | Lykins et al. (1988); Fronk et al. (1990) | |
| Polyamide** | 17.5 - 22.2 (GW) | 52.6 -71.2 | Lykins et al. (1988); Fronk et al. (1990) | |
| Aldicarb Sulfoxide | Cellulose Acetate | 39 (GW) | > 97.4 | Lykins et al. (1988); Fronk et al. (1990) |
| Polyamide | 39 (GW) | > 97.4 | Lykins et al. (1988); Fronk et al. (1990) | |
| Thin Film Composite* | 39 (GW) | 94.9 - 97.4 | Lykins et al. (1988); Fronk et al. (1990) | |
| Polyamide** | 11.2 - 20.0 (GW) | 91.1 - 95.0 | Lykins et al. (1988); Fronk et al. (1990) | |
| Aldicarb Sulfone | Cellulose Acetate | 47 (GW) | 93.6 | Lykins et al. (1988); Fronk et al. (1990) |
| Polyamide | 47 (GW) | 95.7 | Lykins et al. (1988); Fronk et al. (1990) | |
| Thin Film Composite* | 47 (GW) | 93.6 - 95.8 | Lykins et al. (1988); Fronk et al. (1990) | |
| Polyamide | 14.0 - 31.4 (GW) | 91.4 - 95.8 | Lykins et al. (1988); Fronk et al. (1990) |
* Bench-scale studies using spiked groundwater from Suffolk County, NY
** Pilot-plant studies in Suffolk County, NY