RadNet Air Filter Analysis Results From San Bernardino, CA
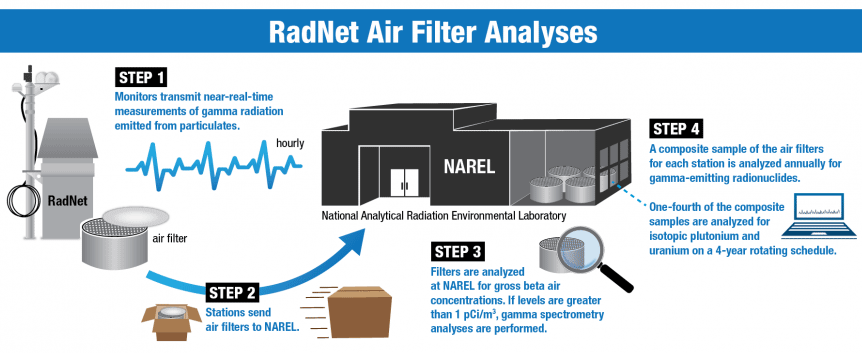
Air filters are collected from each RadNet stationary monitor and sent to the National Analytical Radiation Environmental Laboratory (NAREL) for gross beta air concentration screening and possibly additional analyses. Learn more about RadNet.
Air filters undergo three separate analytical processes, as illustrated below. Results from the initial hourly measurements of gamma radiation emitted from particulates takes place in Step 1. Air filter analysis results (Steps 3 and 4) are reported below in the conventional unit of curies (Ci) per cubic meter of air. Learn more about curies and the international SI unit of becquerel (Bq).
- Gross beta air concentration filter analysis results
- Radionuclide-specific air filter analysis results
- Annual composite sample analysis results
- Results key
- Event key
View RadNet Near-Real-Time Air Monitoring Results from San Bernardino, CA.
Gross Beta Air Concentration Filter Analysis Results
Monitor operators change RadNet air monitor filters and send them to NAREL for analysis. A gross beta air concentration screening is performed at the laboratory on each filter, followed by gamma spectrometry if the beta activity is greater than the screening level of 1 pCi/m3. Following a known release, this screening level may be reduced and additional analyses may be performed. The graph below shows all beta air concentration filter results for this monitoring location.
Radionuclide-specific Air Filter Analysis Results
Gamma spectrometry results are viewable in the Radionuclide-specific Filter Analysis Results table below.
Columns are sortable. See results key below.
Annual Composite Sample Analysis Results
All air filters collected from a location for each calendar year are composited into one sample representing that location. The composite sample for each location is then analyzed by gamma spectrometry (see table above) and, on a four-year rotational basis, for plutonium (Pu-238 and Pu-239/Pu-240) and uranium (U-234, U-235 and U-238) (see table below).
Columns are sortable. See event key below.
Results Key
| Result | Description | |
|---|---|---|
|
Non-Detect |
The radionuclide was not detected with 97.5% confidence. Either no result was measured or a result was less than twice the uncertainty level. |
|
|
Not Analyzed |
The sample was not tested for this radionuclide. |
|
Event Key
| Label | Description | |
|---|---|---|
|
Non-Event |
These air filters are not associated with any large scale radiological incident. Examples include analyses initiated in response to exceeding screening levels or analyses conducted in response to very low level detections by other international air monitoring agencies. Learn more about RadNet Air Filter Inquiries. |
|
|
Composite |
At the end of each year, scientists combine all the air filters for each monitor and run gamma analyses. Alpha analyses are performed on the composites from one-fourth of the stations on a four-year rotating schedule. |
|
|
Event A |
Chinese Nuclear Test |
Air filter analysis results from July through December 1980 can be viewed in Environmental Radiation Data Report (ERD) 23 and 24. Search EPA Archive |
|
Event B |
Chernobyl, Ukraine |
These air filters were analyzed in the 90 days following the Chernobyl Nuclear Power Plant incident. The results are not necessarily related to this event. Learn about EPA's Radiological Monitoring during Chernobyl. |
|
Event C |
Tokaimura, Japan |
These air filters were analyzed in the 90 days following the Tokaimura Nuclear Reactor accident. The results are not necessarily related to this event. |
|
Event D |
Los Alamos, New Mexico |
These air filters were analyzed in the 90 days following the Cerro Grande fire, which threatened a historically contaminated site. The results are not necessarily related to this event. |
|
Event E |
Hanford, Washington |
These air filters were analyzed in the 90 days following the fires at the Hanford Nuclear Reservation. The results are not necessarily related to this event. |
|
Event F |
Fukushima, Japan |
These air filters were analyzed in the 90 days following the tsunami that damaged the Fukushima Daiichi Nuclear Power Plant. The results are not necessarily related to this event. Learn about EPA's Radiological Monitoring during Fukushima. |
|
Event G |
Los Alamos, New Mexico |
These air filters were analyzed in the 90 days following the Las Conchas fire, which threatened a historically contaminated site. The results are not necessarily related to this event. |
Note: All results (activity concentrations) have been radioactive decay corrected back to the sample collection end date/time (UTC).

