RadNet Near-Real-Time Air Data From Idaho Falls, ID
This page contains hourly data transmitted from RadNet stationary air monitors to EPA’s National Analytical Radiation Environmental Laboratory (NAREL). All RadNet stations measure gamma radiation emitted from airborne radioactive particles as they collect on the monitor's filter. These data are posted below on the "Gamma Gross Count Rate" graph. Learn more about RadNet.
Some RadNet monitors also measure exposure rate, which indicates the level of gamma radiation in the vicinity of the monitor. Exposure rate data are posted below, if available.
To view individual hourly measurements, please search the RadNet database in EPA's Central Data Exchange or view the RadNet CSV File Download webpage.
View RadNet Air Filter Analysis Results from Idaho Falls, ID.
Gamma Gross Count Rate
RadNet stationary air monitors measure gamma radiation emitted from airborne radioactive particles as they collect on the monitor's filter. EPA uses RadNet monitors to track fluctuations in gamma ![]() gammaGamma rays come from many different radioactive elements, both natural and man-made. Gamma rays can penetrate several feet of concrete or a few inches of lead. Gamma rays can pose a serious health threat inside and outside the body and can be lethal depending on the amount received. Scientists use the properties of gamma rays to identify radioactive elements. radiation emitted from airborne radioactive particles at each of our sites. Tracking these changes over time gives a picture of the background (normal) levels and allows EPA scientists to detect any unusual changes.
gammaGamma rays come from many different radioactive elements, both natural and man-made. Gamma rays can penetrate several feet of concrete or a few inches of lead. Gamma rays can pose a serious health threat inside and outside the body and can be lethal depending on the amount received. Scientists use the properties of gamma rays to identify radioactive elements. radiation emitted from airborne radioactive particles at each of our sites. Tracking these changes over time gives a picture of the background (normal) levels and allows EPA scientists to detect any unusual changes.
You can see a more detailed view of gamma detection across nine different channel ranges in our Gamma Gross Count Rate (by Channel Range) Graph.
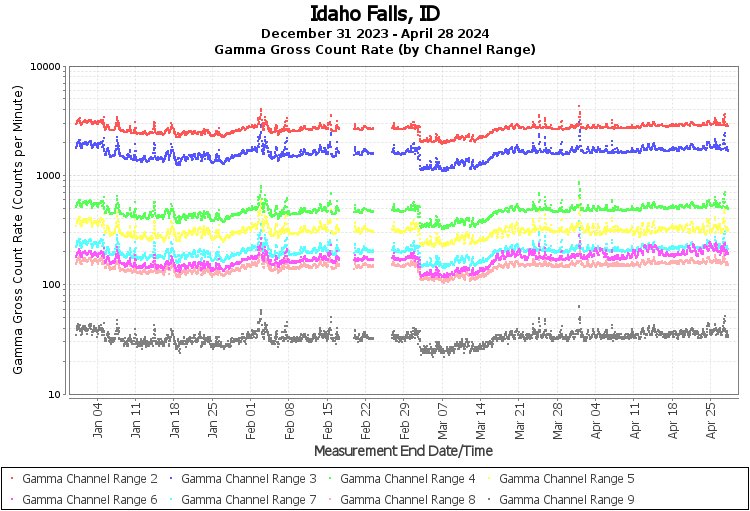
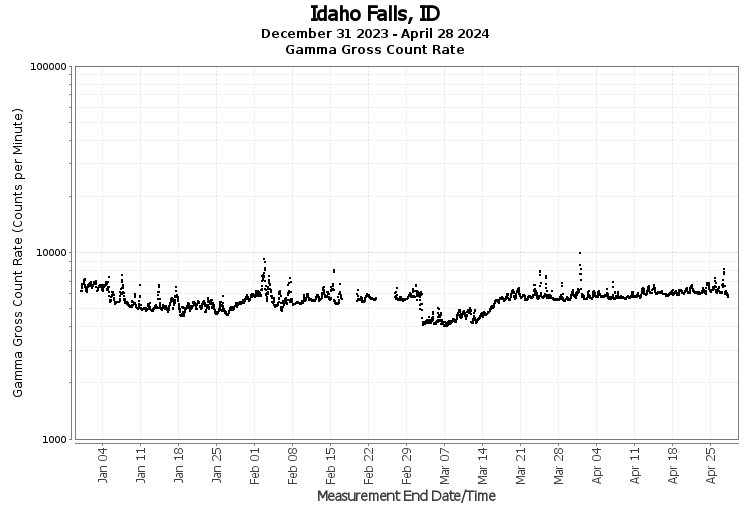
About the Gamma Gross Count Rate Graph
- The Gamma Gross Count Rate represents how many gamma rays the monitor detects each minute.
- To view the individual data points shown on this graph, please use the query tool to search the RadNet database in EPA's Central Data Exchange.
Exposure Rate
In an effort to make RadNet radiation data more understandable to the public and easier to compare with international data, EPA is adding exposure rate measurements to our other system capabilities. Exposure rate measurements indicate the level of radiation present per hour in the vicinity of the monitor.
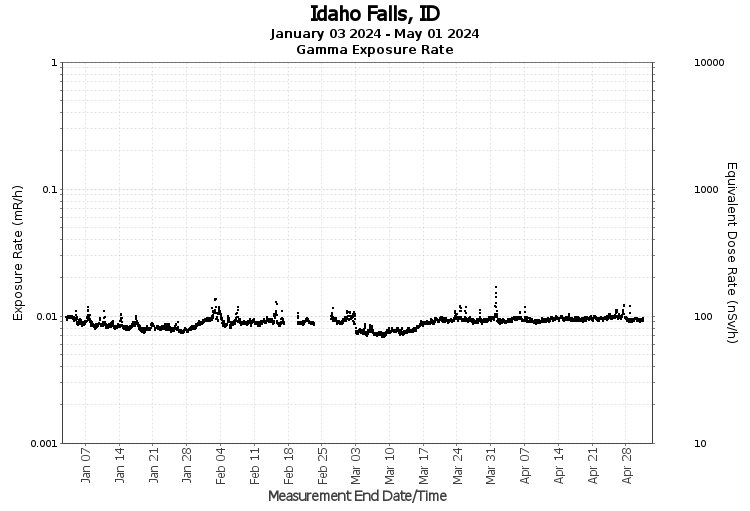
About the Exposure Rate Graph
- Idaho Falls, ID began reporting exposure rate data on December 4, 2019.
- The left axis of the graph shows gamma exposure rate in US units of milliRoentgen per hour (mR/h). The right axis shows equivalent dose rate in the international units of nanoSieverts per hour (nSv/h), which is provided for easy comparison with international monitoring stations.
- To learn about typical dose rates, view About Exposure and Dose Rates.