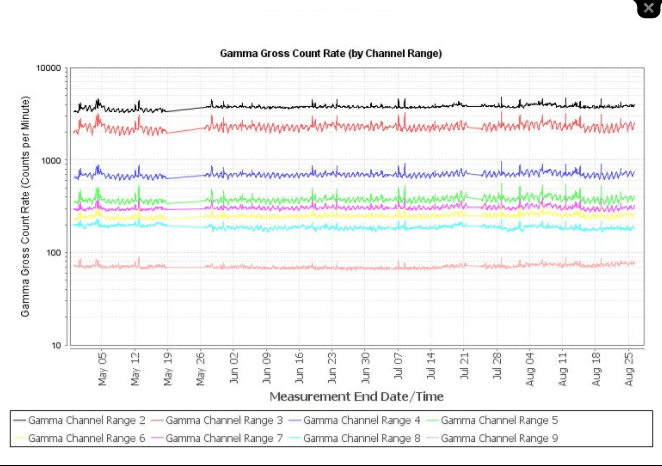
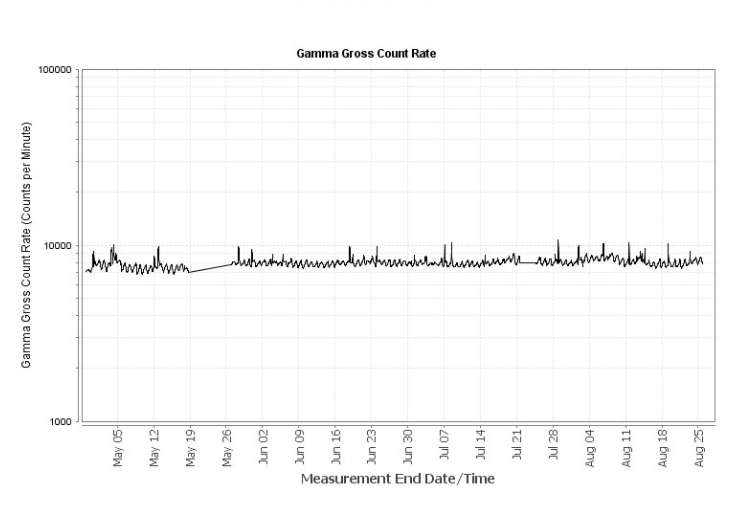
The EPA uses RadNet monitors to track fluctuations in gamma radiation emitted from airborne radioactive particles at each air monitoring site. Tracking these changes over time gives a picture of the normal, background levels at each monitoring location and allows EPA scientists to detect any unusual changes. A graph of near-real-time air results by gamma channel range can be viewed on individual monitoring webpages or results can be downloaded in CSV format on the RadNet CSV File Download webpage.
The gamma gross count rates measured by RadNet air monitors show how many gamma rays the monitor detects each minute. These measurements are sent to the EPA’s National Analytical Radiation Environmental Laboratory (NAREL) at regular intervals throughout each day for review and processing by trained EPA scientists.
Data are split into gamma channel ranges to allow EPA scientists greater sensitivity when identifying anomalous readings. When multiple hours of data are looked at together we can track "normal" or "background" radiation levels at each air monitoring location.

Adding the channel ranges together provides a broader-scale view of trends at each monitoring location.

When the RadNet computer system detects an elevated reading from an air monitor in any of the ranges, those data are reviewed by EPA scientists who are specially trained in understanding the data and identifying specific radionuclides.
For more information, visit RadNet.
