Coast-to-Crest Monitoring Network – Data in Demand
Published August 22, 2017.
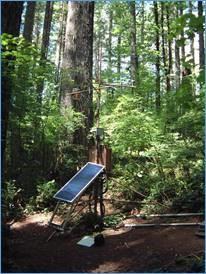 Meteorological station in closed-canopy forest stand.Forested watersheds in the Pacific Northwest are largely responsible for the region’s clean water, but they are vulnerable to threats such as diseases, wildfire, pests, and a changing climate. To better understand how forests respond to these threats, EPA has partnered with the US Forest Service to establish a network of monitoring sites in the Coast and Cascade Mountain Ranges of western Oregon. Each site is about a hectare in size and includes a forest and an adjacent open area. Scientists measure meteorological data at each site including air temperature, relative humidity, solar radiation, and soil temperature and moisture. Measurements are also taken on trees to measure seasonal and annual growth.
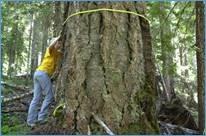 Tree mortality survey conducted every 5-10 years to track changes in forest health and condition.Across these forests, more and more trees are dying. The field sites and long-term climate record are key to understanding the climatic and spatial factors influencing tree mortality. Scientists have mapped every single tree at each field site. In addition, the diameter of each tree has been measured at ground level, as well as its total height, proportion of canopy with live foliage, and health status. By tracking the rate of tree growth and mortality at the field sites and comparing it to changes in climate, EPA can better understand how these economically important forests may be impacted by changes in atmospheric or soil conditions, pests, disease, or other biological factors.
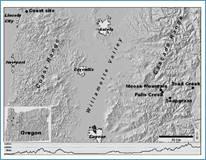 Permanent EPA monitoring sites from Coast to Crest in Oregon.
This data has also helped the Forest Service improve environmental assessments for a timber thinning project. The long-term monitoring data show all sites exhibit soil warming trends, but forest growth may increase or decrease depending on a given year’s air temperature, relative humidity, and soil moisture during the critical, springtime, growing season. The Forest Service uses this information to decide whether a forest needs to be thinned.
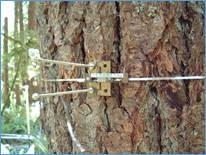 Band dendrometer to measure stem circumference repeatedly at regular intervals.
After seeing the value of the monitoring dataset, the Forest Service asked EPA researcher Ron Waschmann to help with a modeling project that uses LiDAR data to estimate solar illumination conditions in forested landscapes. LiDAR—Light Detection and Ranging—is a remote sensing method used to examine the surface of the Earth. The Forest Service uses LiDAR to help estimate timber volume and biomass of a forest area. The idea is to expand the model to estimate the amount of solar energy incident upon the soil and ground vegetation at any time, or time period. EPA’s monitoring data can be used to test and validate the model.
In the future, the data from this monitoring project could play an important role in EPA’s wildfire research. Many of these forest monitoring sites are at risk of future controlled or uncontrolled fires. If a fire occurs, the monitoring data from this project will help scientists understand the baseline air quality conditions before the wildfire, as well as the air quality conditions during and after the burn. These data are important for modeling and predicting how a wildfire would affect people living in the surrounding area.